
- Title
-
Protective effects of 24-epibrassinolide against the 6-OHDA zebrafish model of Parkinson's disease
- Authors
- Gomes, A., Monteiro, S.M., Venâncio, C., Félix, L.
- Source
- Full text @ Comp. Biochem. Physiol. C Toxicol. Pharmacol.
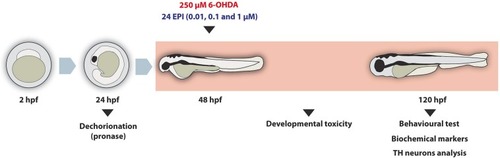
Fig. 1. Exposure and analysis timeline. Fertilised eggs were collected at ∼2 h post-fertilization (hpf) and allowed to develop up to 24 hpf. At this point, the chorion was removed by pronase treatment and at 48 hpf animals were exposed for 72 h to 250 μM 6-OHDA, concomitantly to 24-EPI at different concentrations (0.01, 0.1 and 1 μM) and to 1 μM 24-EPI. Throughout the experimental period, developmental effects were assayed and, at the end of the exposure period, behavioural, oxidative-stress related parameters and TH-immunofluorescent neurons were evaluated. |
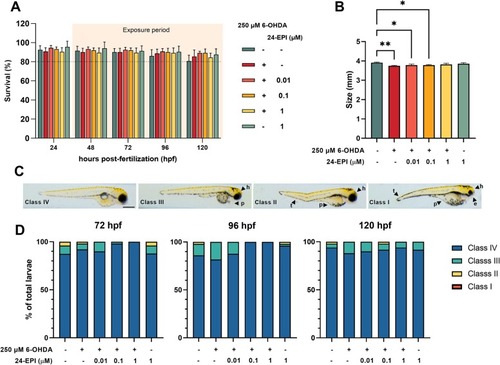
Fig. 2. Morphological assessment of zebrafish larvae during the experimental period. (A) Results for cumulative mortality throughout the exposure period. Data is expressed as mean ± SD from five independent replicates. No statistical differences were observed over time. (B) larvae body size. Data is expressed as mean ± SD from five independent replicates (10 larvae assayed for each treatment, n = 1). (C) Different classes attributed according to the morphological alterations induced by the treatment. The scale bar represents 500 μm. (D) Percentage of larvae in each morphological class at 72, 96 and 120 hpf for the different treatments. Data are presented as means with n = 5 (10 larvae assessed per replicate). PHENOTYPE:
|
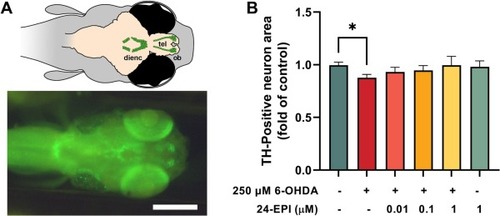
Fig. 3. Tyrosine hydroxylase (TH) immunofluorescence in 6-OHDA-treated zebrafish at 120 hpf. (A) Representative image showing the position of the major groups of dopaminergic (TH-responsive) neurons in zebrafish larval diencephalon (dienc), telencephalon (tel), and olfactory bulbs (ob). (B) Values are expressed as median and interquartile ranges of 5 independent replicates. Statistical analysis was made using the Kruskall-Wallis test followed by the Dunn’s test and * indicates significant differences (p < 0.05). |
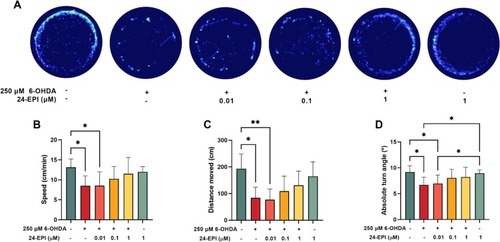
Fig. 4. Representative locomotion path (A), Speed (B), distance travelled (C), and turning angle (D) of zebrafish larvae at 120 hpf. Values are expressed as mean ± standard deviation (D) or as median and interquartile ranges (B and C) of 10 independent replicates (10 animals per replicate). Statistical analysis was performed using one-way ANOVA followed by Tukey's multiple-comparison test or Kruskal-Wallis followed by Dunn’s test and *, ** indicates significant differences (p < 0.05 and p < 0.01, respectively). PHENOTYPE:
|