
Image
|
Figure Caption
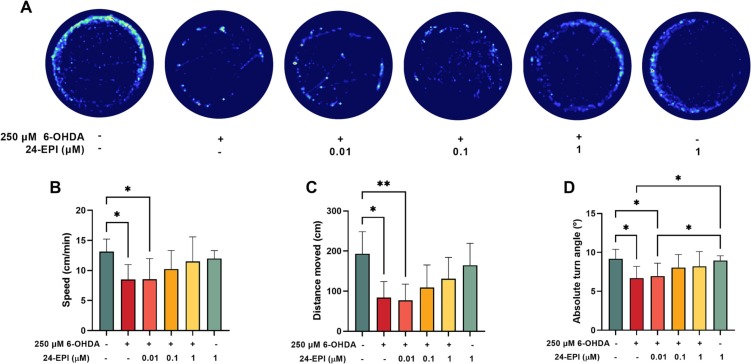
Fig. 4 Fig. 4. Representative locomotion path (A), Speed (B), distance travelled (C), and turning angle (D) of zebrafish larvae at 120 hpf. Values are expressed as mean ± standard deviation (D) or as median and interquartile ranges (B and C) of 10 independent replicates (10 animals per replicate). Statistical analysis was performed using one-way ANOVA followed by Tukey's multiple-comparison test or Kruskal-Wallis followed by Dunn’s test and *, ** indicates significant differences (p < 0.05 and p < 0.01, respectively).
Figure Data
Acknowledgments
This image is the copyrighted work of the attributed author or publisher, and
ZFIN has permission only to display this image to its users.
Additional permissions should be obtained from the applicable author or publisher of the image.
Full text @ Comp. Biochem. Physiol. C Toxicol. Pharmacol.