
FIGURE SUMMARY
- Title
-
FSCN1 as a new druggable target in adrenocortical carcinoma
- Authors
- Ruggiero, C., Tamburello, M., Rossini, E., Zini, S., Durand, N., Cantini, G., Cioppi, F., Hantel, C., Kiseljak-Vassiliades, K., Wierman, M.E., Landwehr, L.S., Weigand, I., Kurlbaum, M., Zizioli, D., Turtoi, A., Yang, S., Berruti, A., Luconi, M., Sigala, S., Lalli, E.
- Source
- Full text @ Int. J. Cancer
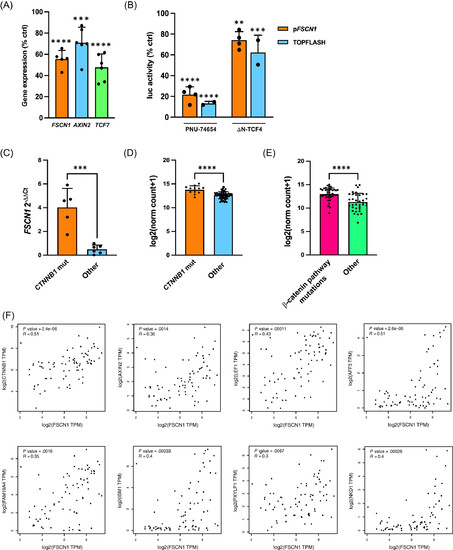
FSCN1 expression is linked to β-catenin activation in ACC. (A) The β-catenin inhibitor PNU-74654 inhibits expression of FSCN1, AXIN2 and TCF7 in H295R cells. Cells were treated with drug (100 μM) or vehicle for 24 h, then gene expression was measured by RT-qPCR. Results are shown as percentage of expression compared with vehicle-treated cells. n (independent experiments) = 5–6. Mean ± SD is shown. ***P < .001; ****P < .0001, one-way ANOVA with Šidák's multiple comparisons test. (B) The FSCN1 promoter is repressed by inhibition of β-catenin transcriptional activity in H295R cells. Cells were transfected with FSCN1 promoter-luciferase reporter (pFSCN1) or the control β-catenin-responsive TOPFLASH reporter. To inhibit β-catenin, cells were either treated with PNU-74654 (100 μM) or cotransfected with a dominant-negative TCF4 (ΔN-TCF4) expression plasmid. Results are shown as percentage of luciferase activity compared with vehicle-treated cells (PNU-74654) or empty expression vector (ΔN-TCF4). n (independent experiments) = 2-4. Mean ± SD is shown. **P < .01; ***P < .001; ****P < .0001, one-way ANOVA with Šidák's multiple comparisons test. (C) Higher FSCN1 mRNA levels in CTNNB1-mutated ACC than in tumors without CTNNB1 mutations in the Florence cohort; n (patients number) = 11. Mean ± SD is shown. ***P < .001, t-test. (D) Higher FSCN1 mRNA levels in CTNNB1-mutated and (E) beta-catenin pathway (APC, ZNRF3, CTNNB1)-mutated ACC compared with other tumors in the TCGA cohort; n (patients number) = 78. Mean ± SD is shown. ****P < .0001, t test. Data were retrieved and analyzed using Xena (https://xenabrowser.net). (F) Positive correlation of expression between FSCN1-CTNNB1 and β-catenin target genes AXIN2, LEF1, AFF3, FAM194A, ISM1, PXYLP1 and NKD1 in ACC from the TCGA cohort. Data were retrieved and analyzed using GEPIA (http://gepia.cancer-pku.cn/detail.php?clicktag=correlation).
|
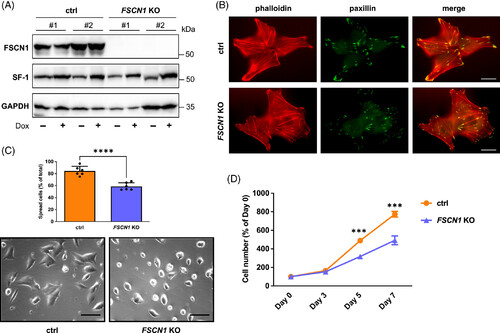
FSCN1 inactivation in H295R cells causes defects in spreading after plating and proliferation. (A) Western blot showing expression of FSCN1, SF-1 and GAPDH in control #1 and #2 and in FSCN1 KO #1 and #2 H295R clones in basal conditions and after treatment with Dox (1 μg/ml) for 72 h. (B) Staining of control and FSCN1 KO cells with phalloidin (actin cytoskeleton; in red) and paxillin (focal adhesions; in green). Scale bar, 5 μm. (C) FSCN1 KO cells have a spreading defect after plating. The histogram shows the percentage of spread cells 48 h after plating for control and FSCN1 KO H295R cells. Data are derived from the combined analysis of control #1 and #2 (orange) and FSCN1 KO #1 and #2 H295R clones (violet). Data for individual clones are shown in Figure S1. n (independent experiments) = 6. Mean ± SD is shown. ****P < 0.0001, t test. Bottom: Representative micrographs of control and FSCN1 KO cells taken 48 h after plating. Scale bar, 20 μm. (D) FSCN1 KO cells proliferation is slower compared with control cells. Data are derived from the combined analysis of control #1 and #2 (orange line) and FSCN1 KO #1 and #2 H295R clones (violet line). Cells were cultured without adding Dox in the culture medium. Data for individual clones are shown in Figure S3. n (independent experiments) = 6. Mean ± SD is shown. ***P < .001, t test.
|
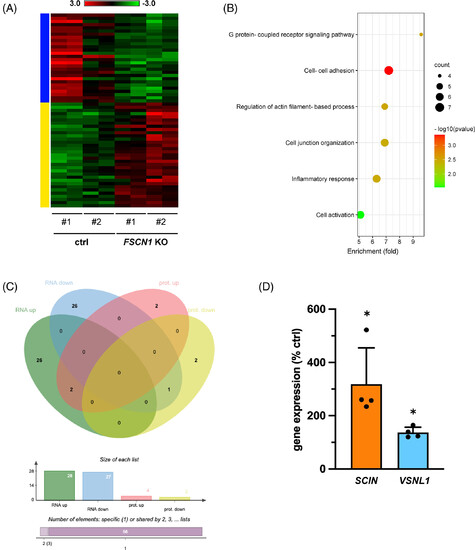
Differences in gene and protein expression in FSCN1 KO compared with ctrl H295R cells. (A) Heatmap of differentially expressed genes (DEG) in FSCN1 KO cells compared with control cells. The yellow bar indicates genes upregulated, the blue bar genes downregulated in FSCN1 KO cells, respectively. Log2 scale is shown. (B) Gene Ontology (Biological Processes) categories enriched in DEG. (C) Intersection of the lists of transcripts and proteins found differentially regulated in FSCN1 KO vs control cells. SCIN and VSNL1 were upregulated at both the transcript and protein levels in FSCN1 KO cells. (D) Transcript levels of SCIN and VSNL1 measured by RT-qPCR in FSCN1 KO and control H295R cells. n (independent experiments) = 4. Mean ± SD is shown. *P < .05, t test.
|
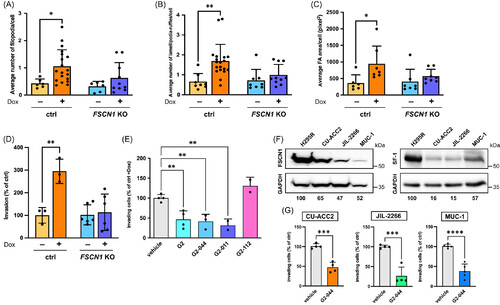
FSCN1 inactivation or pharmacological inhibition reduces in vitro Matrigel invasion of ACC cells. Number of (A) filopodia, (B) lamellipodia/ruffles and (C) area of focal adhesions per cell in control and FSCN1 KO H295R cells treated with either vehicle or Dox (1 μg/ml) for 24 h. n (independent experiments) = 6-9. Mean ± SD is shown. *P < .05; **P < .01, one-way ANOVA with Šidák's multiple comparisons test. (D) In vitro Matrigel invasion of control and FSCN1 KO H295R cells treated with either vehicle or Dox (1 μg/ml). Results are expressed as percentages of control cell invasion. n (independent experiments) = 3-6. Mean ± SD is shown. **P < .01, one-way ANOVA with Šidák's multiple comparisons test. (E) In vitro Matrigel invasion of control H295R cells treated with Dox (1 μg/ml) and with vehicle or G2 (50 μM), G2-044, G2-011 or the inactive G2-112 compound (all 5 μM). n (independent experiments) = 2-4. Mean ± SD is shown. **P < .01, one-way ANOVA with Šidák's multiple comparisons test. (F) Left: immunoblot showing expression of FSCN1 and GAPDH in H295R, CU-ACC2, JIL-2266 and MUC-1 cells. FSCN1 levels (relative to GAPDH) in the CU-ACC2, JIL-2266 and MUC-1 ACC cell lines are indicated as percentages of H295R, which express the highest levels of FSCN1. Right: immunoblot showing expression of SF-1 and GAPDH in H295R, CU-ACC2, JIL-2266 and MUC-1 cells. SF-1 levels (relative to GAPDH) in the CU-ACC2, JIL-2266 and MUC-1 ACC cell lines are indicated as percentages of H295R, which express the highest levels of SF-1. FSCN1 and SF-1 band intensities were quantified by Image J after GAPDH normalization. n (independent experiments) = 3. G) Matrigel invasion of those ACC cell lines treated with vehicle or G2-044 (5 μM). n (independent experiments) = 4-5. Mean ± SD is shown. ***P < .001; ****P < .0001, t test.
|
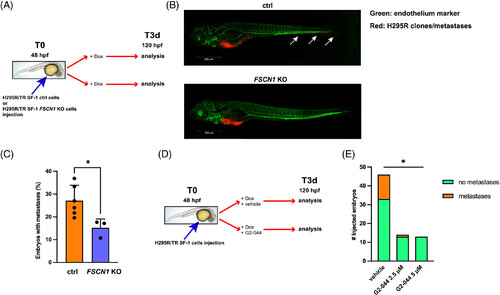
FSCN1 inactivation or pharmacological inhibition reduces invasion in an in vivo zebrafish metastatic ACC model. (A) Diagram showing the plan of the zebrafish experiments involving ctrl and FSCN1 KO H295R/TR SF-1 clones. Dox-pretreated cells were injected in the yolk sac of 48 hpf zebrafish embryos and Dox (1 μg/ml) was added to the water bath. Embryos were fixed and analyzed 3 days later at 120 hpf. (B) Representative lateral view images of Tg(kdrl:EGFP) embryos at 120 hpf xenografted with H295R cells. Cells are labeled with a red fluorescent lipophilic dye while the embryos' endothelium is labeled with a green fluorescent protein reporter driven by the kdrl promoter. Cells migrated in the caudal region of the zebrafish embryo are indicated by white arrows. Images were acquired using a Zeiss LSM 510 META confocal laser-scanning microscope at ×10 magnification. Top: control cells; bottom: FSCN1 KO cells. Scale bar, 500 μm. Higher magnification images are shown in Figure S7. (C) Percentages of zebrafish embryos injected with control (orange) or FSCN1 KO H295R cells (blue) showing metastases in the presence of Dox (1 μg/ml) in the bath to induce SF-1 overexpression. n (independent experiments) = 3-6, with 164 embryos in total injected with control cells; 97 embryos in total injected with FSCN1 KO cells. Mean ± SD is shown. *P < .05, t test. (D) Diagram showing the plan of the zebrafish experiments aimed to study the effect of the G2-044 FSCN1 inhibitor on the metastatic activity of ctrl H295R/TR SF-1 cells. Dox-pretreated cells were injected in the yolk sac of 48 hpf zebrafish embryos and Dox (1 μg/ml) was added to the water bath together with vehicle or G2-044. Embryos were fixed and analyzed 3 days later at 120 hpf. (E) Number of zebrafish embryos injected with ctrl H295R/TR SF-1 cells treated with vehicle, 2.5 and 5 μM G2-044, respectively. Green, embryos without metastases; orange, embryos with metastases. n (independent experiments) = 2. P < .05, chi-square.
|
Acknowledgments
This image is the copyrighted work of the attributed author or publisher, and
ZFIN has permission only to display this image to its users.
Additional permissions should be obtained from the applicable author or publisher of the image.
Full text @ Int. J. Cancer