
Image
|
Figure Caption
Fig. 5
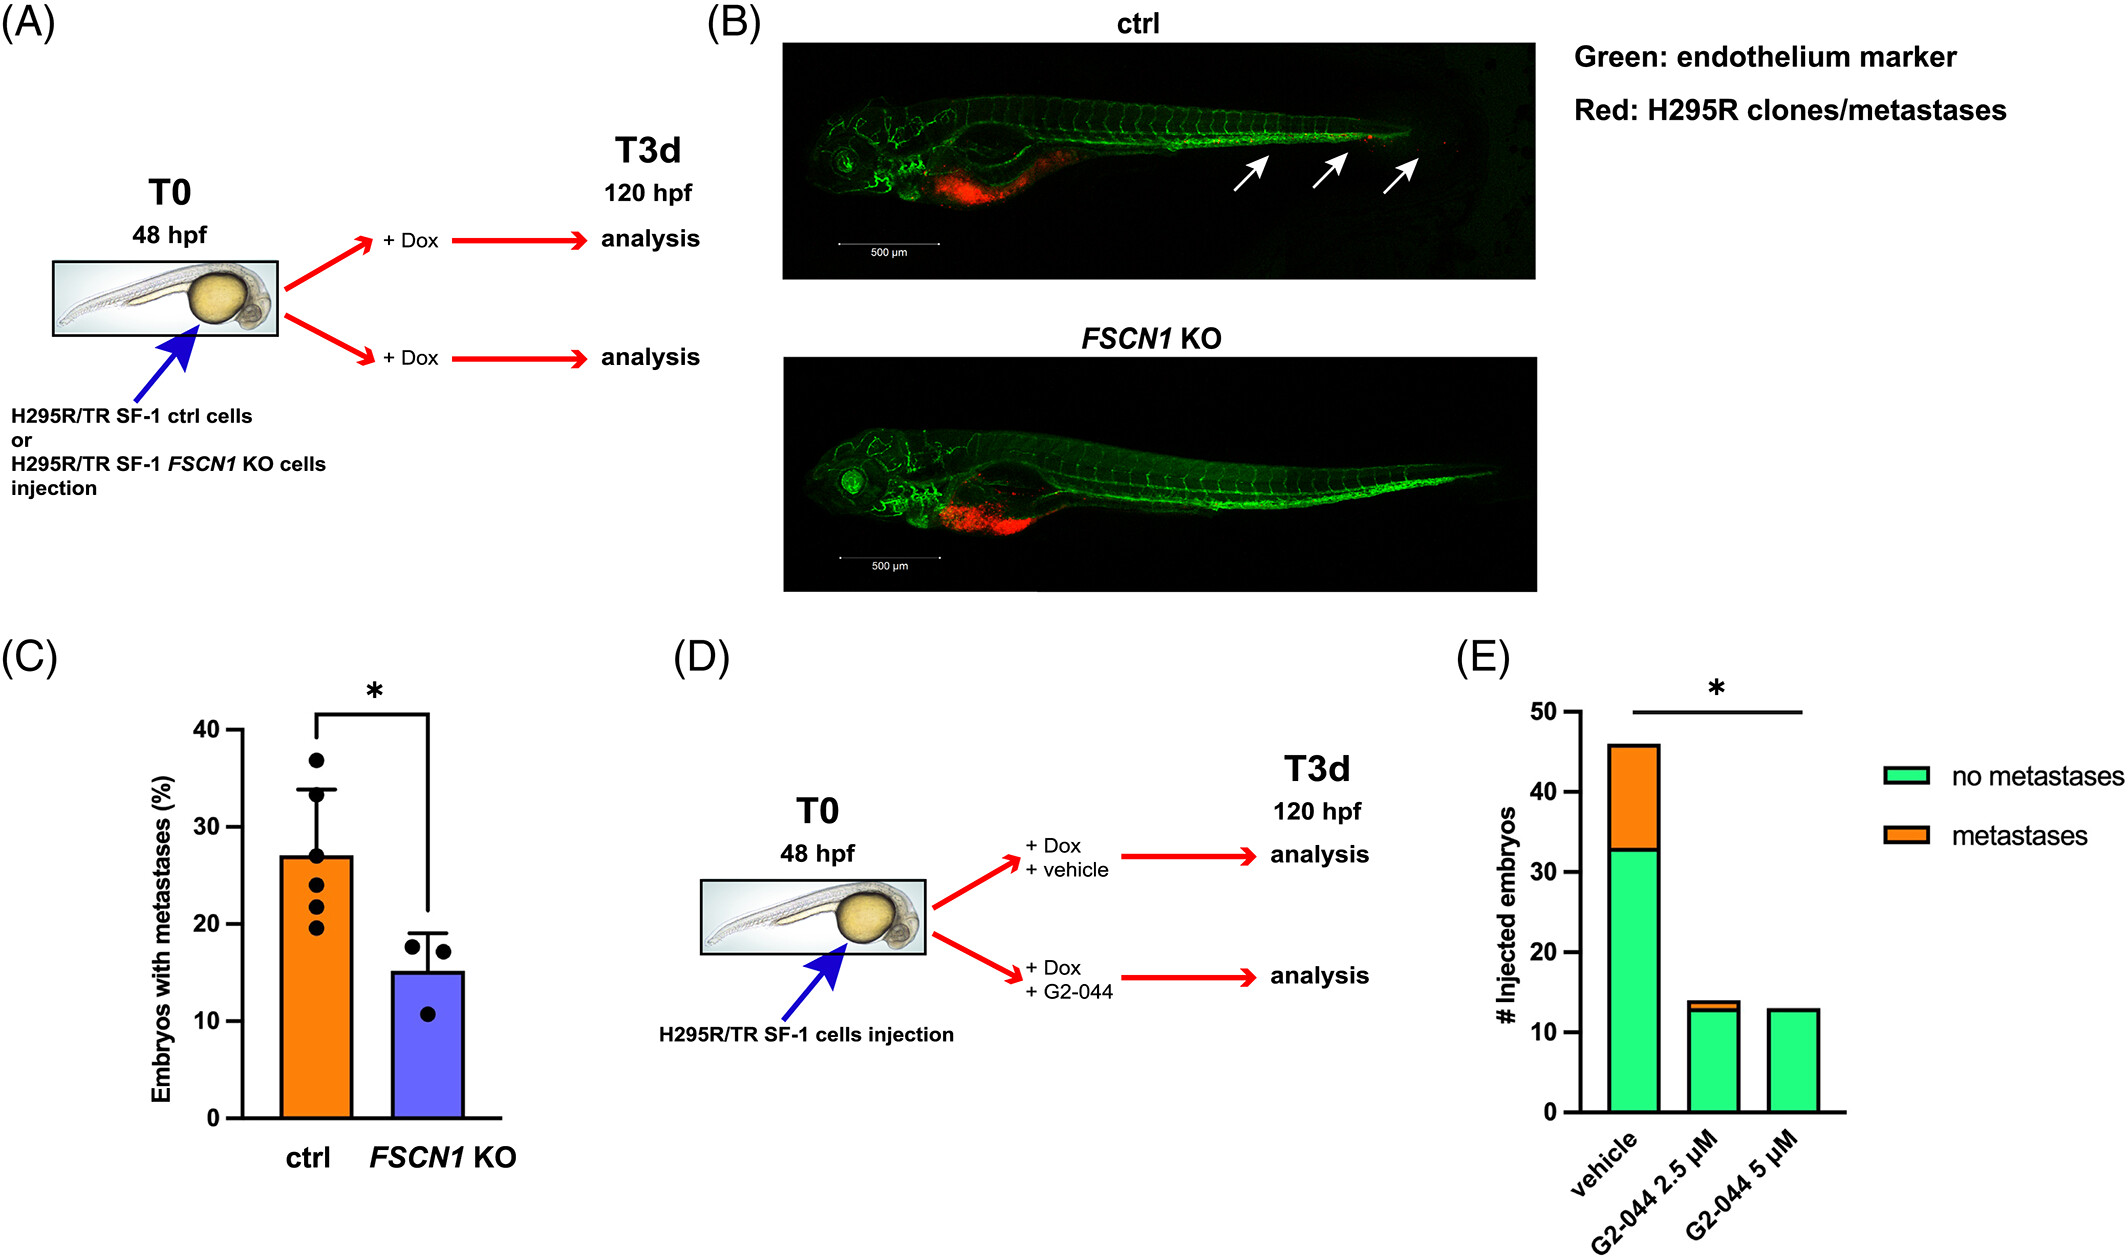
FSCN1 inactivation or pharmacological inhibition reduces invasion in an in vivo zebrafish metastatic ACC model. (A) Diagram showing the plan of the zebrafish experiments involving ctrl and FSCN1 KO H295R/TR SF-1 clones. Dox-pretreated cells were injected in the yolk sac of 48 hpf zebrafish embryos and Dox (1 μg/ml) was added to the water bath. Embryos were fixed and analyzed 3 days later at 120 hpf. (B) Representative lateral view images of Tg(kdrl:EGFP) embryos at 120 hpf xenografted with H295R cells. Cells are labeled with a red fluorescent lipophilic dye while the embryos' endothelium is labeled with a green fluorescent protein reporter driven by the kdrl promoter. Cells migrated in the caudal region of the zebrafish embryo are indicated by white arrows. Images were acquired using a Zeiss LSM 510 META confocal laser-scanning microscope at ×10 magnification. Top: control cells; bottom: FSCN1 KO cells. Scale bar, 500 μm. Higher magnification images are shown in Figure S7. (C) Percentages of zebrafish embryos injected with control (orange) or FSCN1 KO H295R cells (blue) showing metastases in the presence of Dox (1 μg/ml) in the bath to induce SF-1 overexpression. n (independent experiments) = 3-6, with 164 embryos in total injected with control cells; 97 embryos in total injected with FSCN1 KO cells. Mean ± SD is shown. *P < .05, t test. (D) Diagram showing the plan of the zebrafish experiments aimed to study the effect of the G2-044 FSCN1 inhibitor on the metastatic activity of ctrl H295R/TR SF-1 cells. Dox-pretreated cells were injected in the yolk sac of 48 hpf zebrafish embryos and Dox (1 μg/ml) was added to the water bath together with vehicle or G2-044. Embryos were fixed and analyzed 3 days later at 120 hpf. (E) Number of zebrafish embryos injected with ctrl H295R/TR SF-1 cells treated with vehicle, 2.5 and 5 μM G2-044, respectively. Green, embryos without metastases; orange, embryos with metastases. n (independent experiments) = 2. P < .05, chi-square.
Acknowledgments
This image is the copyrighted work of the attributed author or publisher, and
ZFIN has permission only to display this image to its users.
Additional permissions should be obtained from the applicable author or publisher of the image.
Full text @ Int. J. Cancer