
Image
|
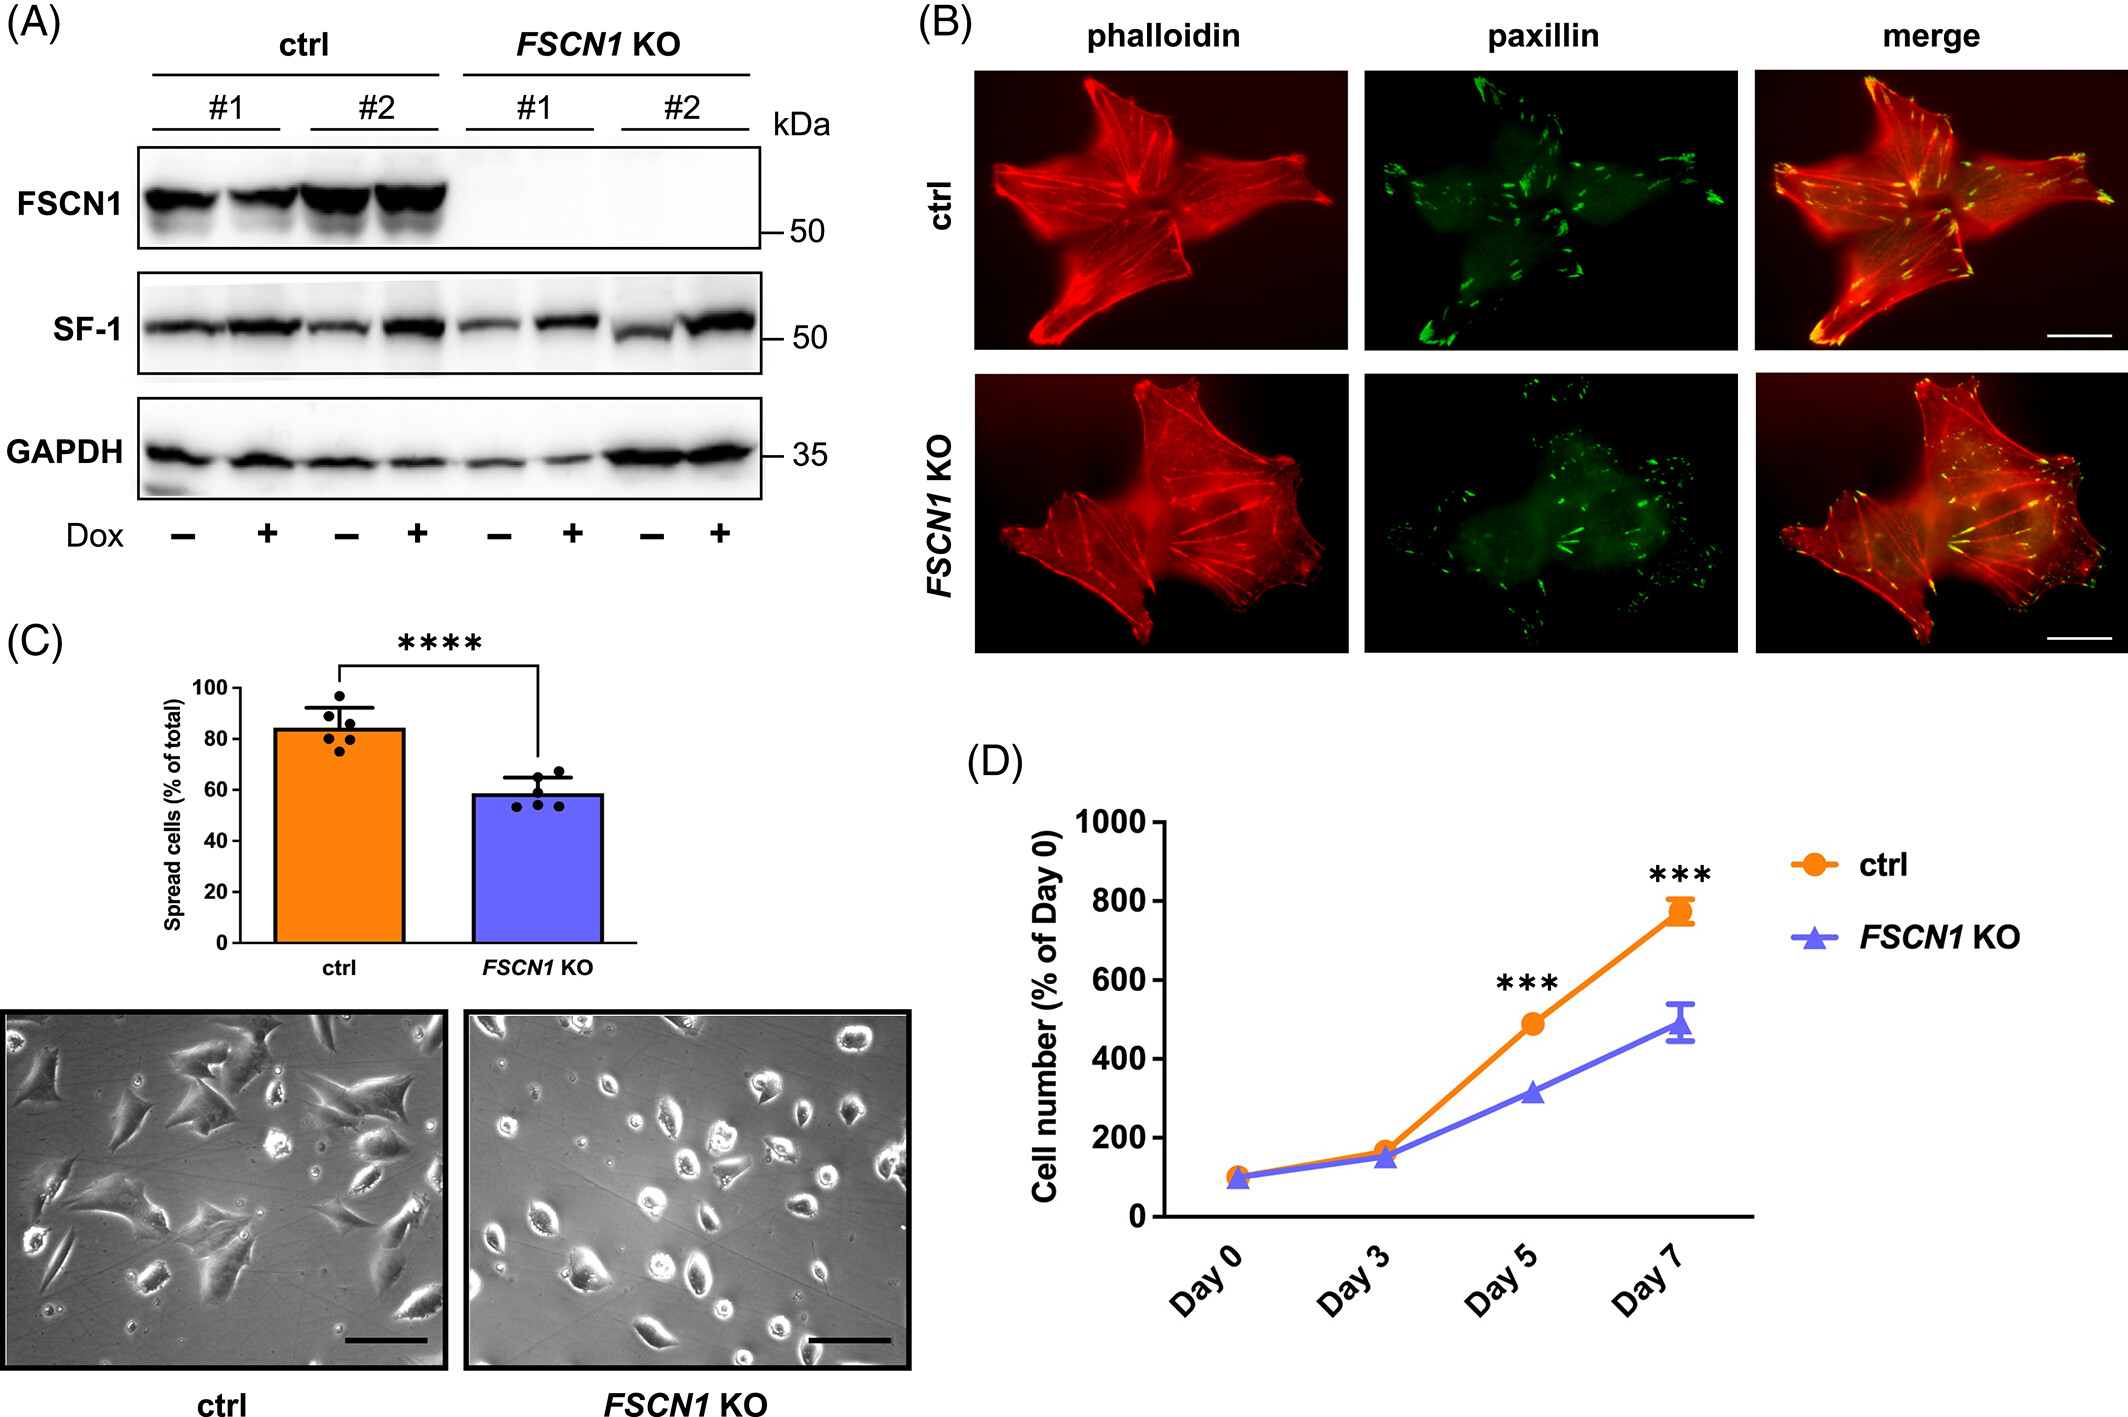
Figure Caption
Fig. 2
FSCN1 inactivation in H295R cells causes defects in spreading after plating and proliferation. (A) Western blot showing expression of FSCN1, SF-1 and GAPDH in control #1 and #2 and in FSCN1 KO #1 and #2 H295R clones in basal conditions and after treatment with Dox (1 μg/ml) for 72 h. (B) Staining of control and FSCN1 KO cells with phalloidin (actin cytoskeleton; in red) and paxillin (focal adhesions; in green). Scale bar, 5 μm. (C) FSCN1 KO cells have a spreading defect after plating. The histogram shows the percentage of spread cells 48 h after plating for control and FSCN1 KO H295R cells. Data are derived from the combined analysis of control #1 and #2 (orange) and FSCN1 KO #1 and #2 H295R clones (violet). Data for individual clones are shown in Figure S1. n (independent experiments) = 6. Mean ± SD is shown. ****P < 0.0001, t test. Bottom: Representative micrographs of control and FSCN1 KO cells taken 48 h after plating. Scale bar, 20 μm. (D) FSCN1 KO cells proliferation is slower compared with control cells. Data are derived from the combined analysis of control #1 and #2 (orange line) and FSCN1 KO #1 and #2 H295R clones (violet line). Cells were cultured without adding Dox in the culture medium. Data for individual clones are shown in Figure S3. n (independent experiments) = 6. Mean ± SD is shown. ***P < .001, t test.
Acknowledgments
This image is the copyrighted work of the attributed author or publisher, and
ZFIN has permission only to display this image to its users.
Additional permissions should be obtained from the applicable author or publisher of the image.
Full text @ Int. J. Cancer