
Image
|
Figure Caption
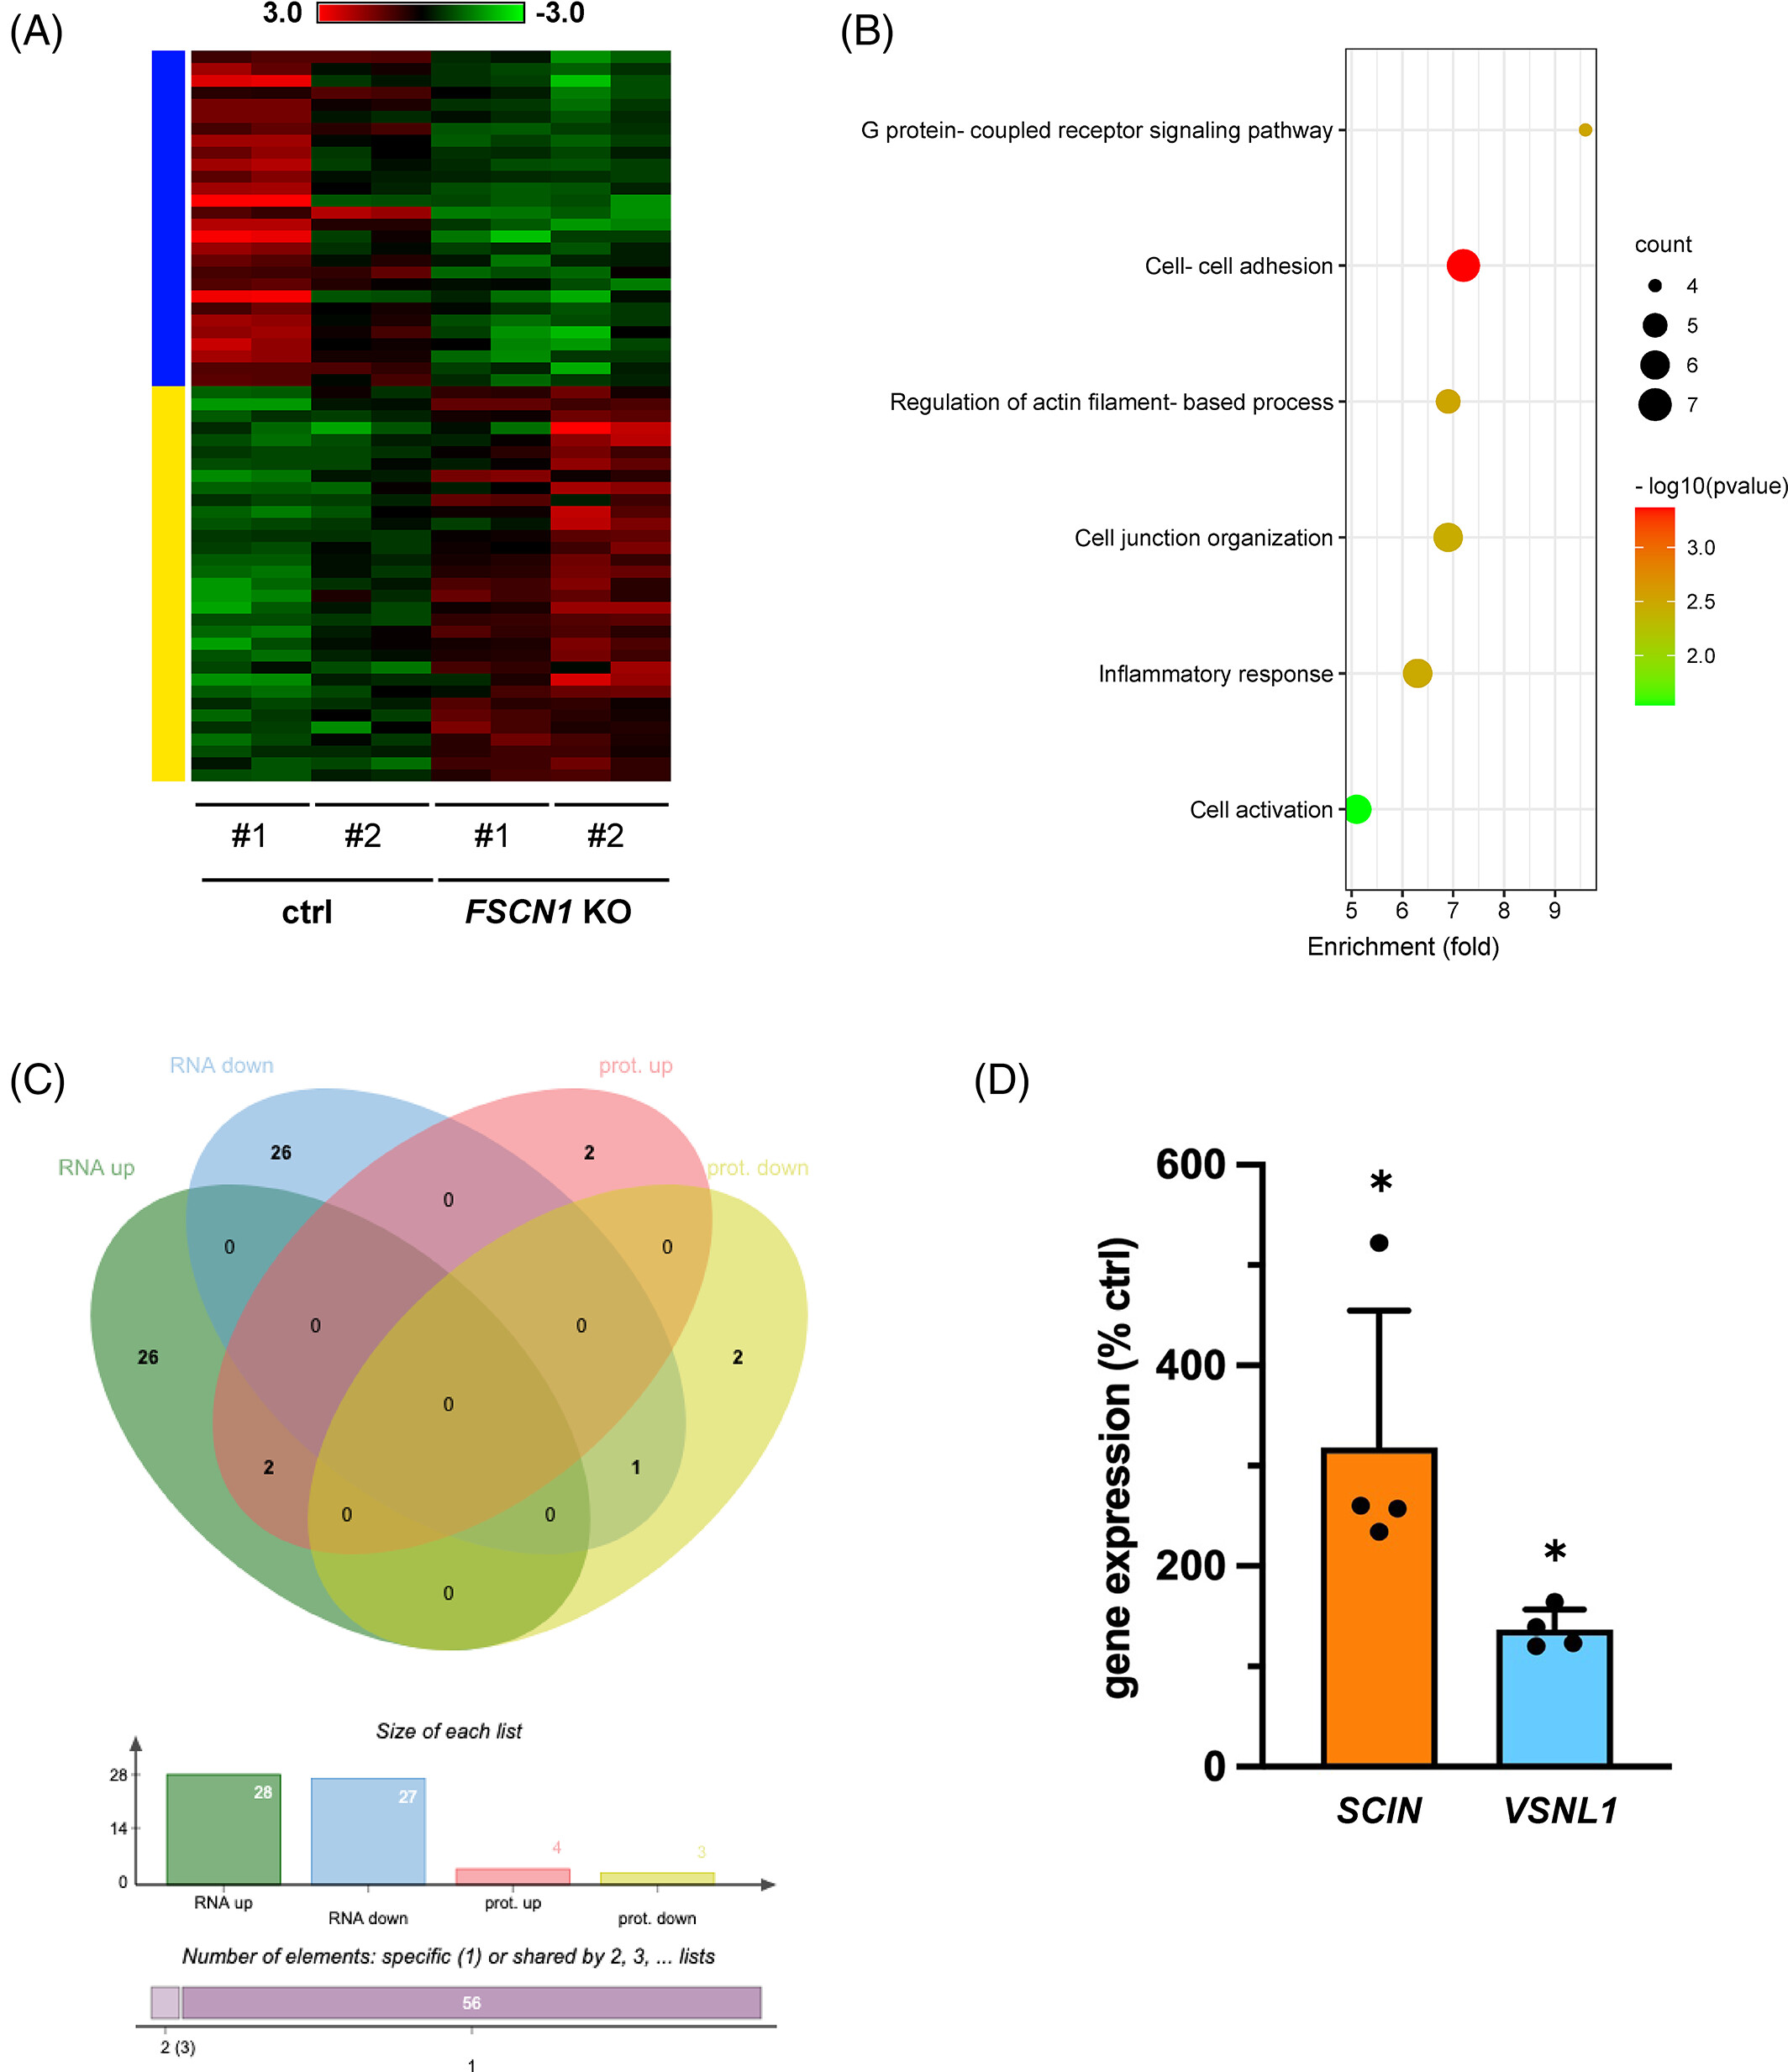
Fig. 3
Differences in gene and protein expression in FSCN1 KO compared with ctrl H295R cells. (A) Heatmap of differentially expressed genes (DEG) in FSCN1 KO cells compared with control cells. The yellow bar indicates genes upregulated, the blue bar genes downregulated in FSCN1 KO cells, respectively. Log2 scale is shown. (B) Gene Ontology (Biological Processes) categories enriched in DEG. (C) Intersection of the lists of transcripts and proteins found differentially regulated in FSCN1 KO vs control cells. SCIN and VSNL1 were upregulated at both the transcript and protein levels in FSCN1 KO cells. (D) Transcript levels of SCIN and VSNL1 measured by RT-qPCR in FSCN1 KO and control H295R cells. n (independent experiments) = 4. Mean ± SD is shown. *P < .05, t test.
Acknowledgments
This image is the copyrighted work of the attributed author or publisher, and
ZFIN has permission only to display this image to its users.
Additional permissions should be obtained from the applicable author or publisher of the image.
Full text @ Int. J. Cancer