
- Title
-
Characterization of a mutant samhd1 zebrafish model implicates dysregulation of cholesterol biosynthesis in Aicardi-Goutières syndrome
- Authors
- Withers, S.E., Rowlands, C.F., Tapia, V.S., Hedley, F., Mosneag, I.E., Crilly, S., Rice, G.I., Badrock, A.P., Hayes, A., Allan, S.M., Briggs, T.A., Kasher, P.R.
- Source
- Full text @ Front Immunol
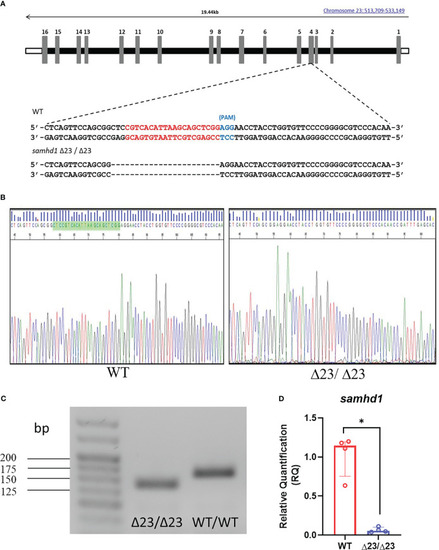
Generation of the samhd1 Δ23/Δ23 line. (A) gRNA sequence (red) designed to target a site within exon 4 of the samhd1 gene to initiate a 23 bp deletion in injected embryos. (B) Sanger sequencing of WT and samhd1 Δ23/Δ23 mutants from fish derived from F1 generation incross. Green highlighted area on WT sequencing represents the site of the 23 bp deletion, causing a frameshift on the mutant sequence. (C) Amplification of samhd1 transcripts from mutant and WT zebrafish embryos using exon 4 specific primers, yielded a single PCR product with clearly visible reduction in band size, as a result of 23 bp deletion. Length of samhd1 exon 4 is 161 bp in WT embryos, with the mutants producing a band of 138 bp. (D) qPCR analysis of samhd1 gene expression in 5 dpf WT and samhd1 Δ23/Δ23 larvae. Data analyzed using Mann Whitney U test and presented as median ± IQR (*P=0.0286). n=20 larvae per group, per biological replicate, repeated 4 times. |
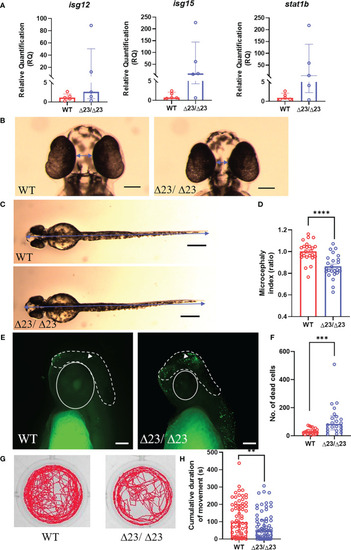
samhd1 Δ23/Δ23 zebrafish exhibit neurological phenotypes. (A) Specific ISG expression (from taqman probes for isg12, isg15 and stat1b, normalized to the housekeeper gene hprt1) measured in 5 dpf WT and samhd1Δ23/Δ23 larval heads, n=30 per biological replicate, repeated 5 times. (B-D) Microcephaly phenotype identified by ventral measurements between the eyes (B) and full body length (C) (blue arrows) to generate a microcephaly index (ratio) determined by distance between the eyes and body length (D). Data analyzed using unpaired t test (****P<0.0001) presented as mean ± SEM. (E, F) Enhanced head cell death in samhd1 Δ23/Δ23 embryos determined through TUNEL staining. White dotted line indicates area of interest for manual cell counting, excluding the eyes, mouth and ears. White triangle denotes TUNEL positive cell used for analysis. n=6-8 embryos per group, with 3 biological replicates. Scale bar= 100 μm. Quantification of number of dead cells (F). Data analyzed using Mann Whitney U test (***P<0.001) presented as median ± IQR. (G) Representative examples of locomotor tracks for 4 dpf samhd1Δ23/Δ23 and WT larvae. (H) Significant decrease in cumulative duration of movement at 4 dpf. n=22-24 larvae per group, with three biological replicates. Data analyzed using a Mann Whitney U test (**P<0.001). |
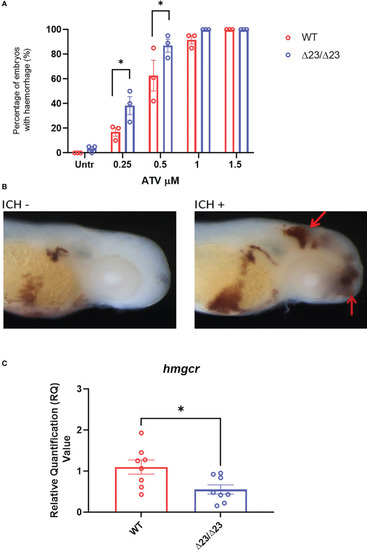
samhd1 Δ23/Δ23 zebrafish exhibit cerebrovascular defects associated with cholesterol dysregulation. (A) WT and samhd1 Δ23/Δ23 embryos were treated with increasing concentrations (0.25-1.5 μM) of ATV added via water bath incubation and scored on the presence or absence of blood in the brain. N=20 embryos treated per group, with the percentage of animals per group which developed hemorrhages determined, repeated three times. Data analyzed using a two-way ANOVA with sidak’s multiple comparisons test (*P<0.05). (B) Representative images of embryos stained for o-dianisodine with and without brain hemorrhage, denoted by red arrow. (C) qPCR analysis of hmgcr expression in the WT and mutant larvae heads at 5 dpf. Data analyzed using unpaired t test (*P<0.05) and presented as mean ± SEM. |
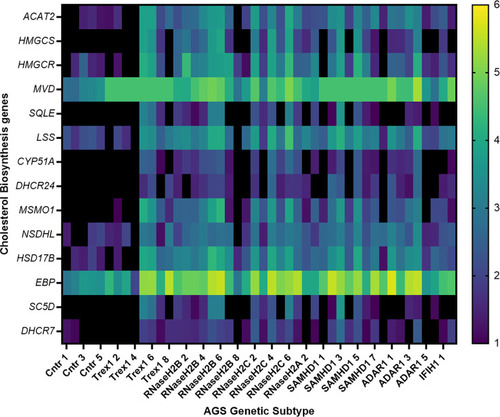
Transcriptional dysregulation of cholesterol biosynthesis genes in AGS patient blood. RNA from AGS1-7 patient whole blood was analyzed using the RSEM software to determine the TPM of each cholesterol biosynthesis gene for the AGS patients. Data was then normalized to an age-matched control group, and underwent a log2 transformation. The heat map scale on right hand side of figure indicates color changes representing 1-6 fold changes in expression. Sample sizes for each AGS subtype: Control n=5, TREX1 n=8, RNaseH2B n=8, RNaseH2C n=6, RNaseH2A n= 3, SAMHD1 n=8, ADAR1 n=6 and IFIH1 n=2. Data analyzed using a one-way ANOVA with Dunnetts multiple comparison test, comparing each AGS gene with the control group. |