
Figure 2
- ID
- ZDB-IMAGE-230324-35
- Genes
- Publication
- Withers et al., 2023 - Characterization of a mutant samhd1 zebrafish model implicates dysregulation of cholesterol biosynthesis in Aicardi-Goutières syndrome
- All Figures
- Figures for Withers et al., 2023
|
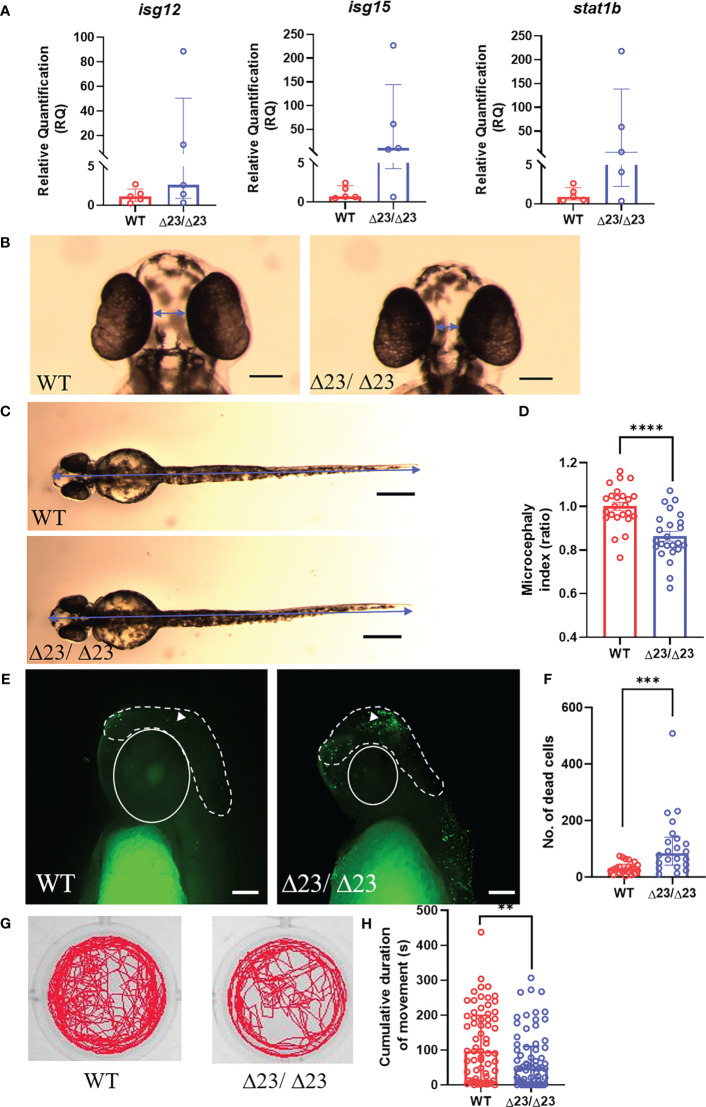
Figure 2
samhd1 Δ23/Δ23 zebrafish exhibit neurological phenotypes. (A) Specific ISG expression (from taqman probes for isg12, isg15 and stat1b, normalized to the housekeeper gene hprt1) measured in 5 dpf WT and samhd1Δ23/Δ23 larval heads, n=30 per biological replicate, repeated 5 times. (B-D) Microcephaly phenotype identified by ventral measurements between the eyes (B) and full body length (C) (blue arrows) to generate a microcephaly index (ratio) determined by distance between the eyes and body length (D). Data analyzed using unpaired t test (****P<0.0001) presented as mean ± SEM. (E, F) Enhanced head cell death in samhd1 Δ23/Δ23 embryos determined through TUNEL staining. White dotted line indicates area of interest for manual cell counting, excluding the eyes, mouth and ears. White triangle denotes TUNEL positive cell used for analysis. n=6-8 embryos per group, with 3 biological replicates. Scale bar= 100 μm. Quantification of number of dead cells (F). Data analyzed using Mann Whitney U test (***P<0.001) presented as median ± IQR. (G) Representative examples of locomotor tracks for 4 dpf samhd1Δ23/Δ23 and WT larvae. (H) Significant decrease in cumulative duration of movement at 4 dpf. n=22-24 larvae per group, with three biological replicates. Data analyzed using a Mann Whitney U test (**P<0.001).