
Figure 4
- ID
- ZDB-IMAGE-230324-37
- Publication
- Withers et al., 2023 - Characterization of a mutant samhd1 zebrafish model implicates dysregulation of cholesterol biosynthesis in Aicardi-Goutières syndrome
- All Figures
- Figures for Withers et al., 2023
|
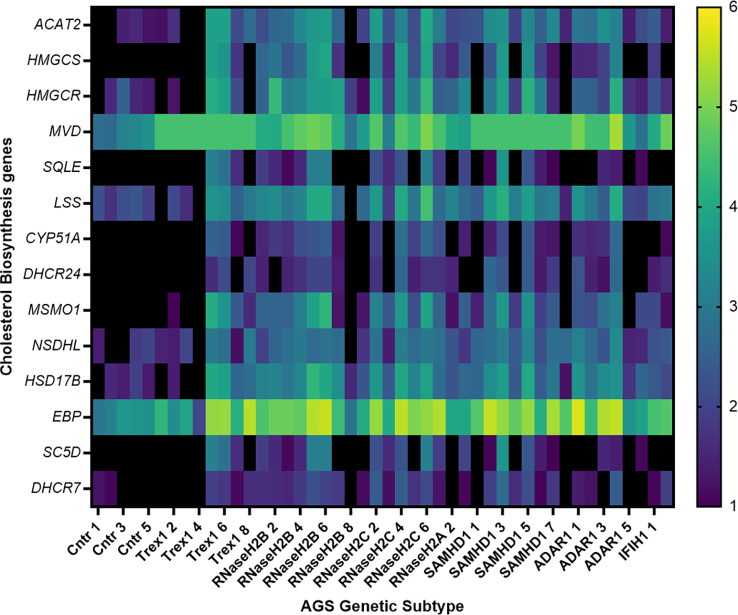
Figure 4
Transcriptional dysregulation of cholesterol biosynthesis genes in AGS patient blood. RNA from AGS1-7 patient whole blood was analyzed using the RSEM software to determine the TPM of each cholesterol biosynthesis gene for the AGS patients. Data was then normalized to an age-matched control group, and underwent a log2 transformation. The heat map scale on right hand side of figure indicates color changes representing 1-6 fold changes in expression. Sample sizes for each AGS subtype: Control n=5, TREX1 n=8, RNaseH2B n=8, RNaseH2C n=6, RNaseH2A n= 3, SAMHD1 n=8, ADAR1 n=6 and IFIH1 n=2. Data analyzed using a one-way ANOVA with Dunnetts multiple comparison test, comparing each AGS gene with the control group.