
- Title
-
Improving adenine and dual base editors through introduction of TadA-8e and Rad51DBD
- Authors
- Xue, N., Liu, X., Zhang, D., Wu, Y., Zhong, Y., Wang, J., Fan, W., Jiang, H., Zhu, B., Ge, X., Gonzalez, R.V.L., Chen, L., Zhang, S., She, P., Zhong, Z., Sun, J., Chen, X., Wang, L., Gu, Z., Zhu, P., Liu, M., Li, D., Zhong, T.P., Zhang, X.
- Source
- Full text @ Nat. Commun.
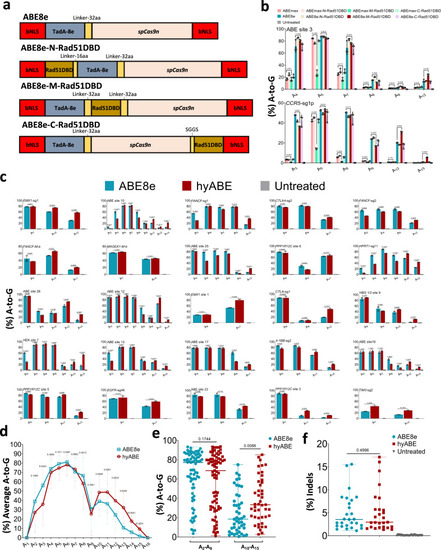
Screening and characterization of hyper ABE.
a Schematics of the constructs with Rad51DBD fused to ABE8e. bNLS, bipartite nuclear localization signals; TadA-8e, derived from evolved E.coil adenosine deaminase; spCas9n, Cas9 D10A; Rad51DBD, single-strand DNA binding domain; Linkers are also shown. b The A-to-G base editing efficiency of ABE8e or its fusion constructs at 2 endogenous genomic loci containing multiple As (ABE site 3 and CCR5-sg1p) in HEK293T cells. Data are means � SD (n = 3 independent experiments). c The A-to-G editing efficiency of ABE8e or hyABE was examined at 25 endogenous genomic loci containing multiple As in HEK293T cells. Data are means � SD (n = 3 independent experiments). d Average A-to-G editing efficiency of ABE8e or hyABE at each position within the protospacer across the 27 target sites in b and c. e Summary of the A-to-G editing efficiency for A2-A9 or A10-A15 induced by ABE8e or hyABE at the 27 target sites in b and c. Each data point represents average A-to-G editing efficiency at all As within the activity window of each target site, calculated from 3 independent experiments. f Frequency of indels formation by ABE8e and hyABE at 27 endogenous genomic loci in b, c. Each data point represents average indels frequency at each target site calculated from 3 independent experiments. Significance was tested with two-tailed Student?s t test (b?d) or two-sided paired Wilcoxon rank-sum test (e, f). Source data are provided as a Source Data file. |
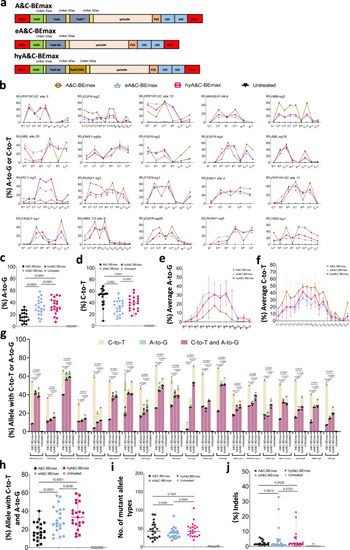
Screening and characterization of hyper A&C-BEmax.
a Schematics of the constructs with Rad51DBD fused to A&C-BEs. b The A-to-G or C-to-T editing efficiency of A&C-BEmax, eA&C-BEmax or hyA&C-BEmax was examined at 20 endogenous target sites in HEK293T cells. Data are means � SD (n = 3 independent experiments). c Summary of the A-to-G editing efficiencies for only the most highly edited adenine induced by dual base editor at the 21 target sites in b and Supplementary Fig. 3b. d Summary of the C-to-T editing efficiencies for only the most highly edited cytosine induced by dual base editors at the 21 target sites in b and Supplementary Fig. 3b. e Average A-to-G editing efficiency of A&C-BEmax, eA&C-BEmax or hyA&C-BEmax at the same 21 target sites in b and Supplementary Fig. 3b. Data are means � SD (n = 3 independent experiments). f Average C-to-T editing efficiency of A&C-BEmax, eA&C-BEmax, or hyA&C-BEmax at the same 21 target sites in b and Supplementary Fig. 3b. Data are means � SD (n = 3 independent experiments). g The allele with A-to-G or C-to-T efficiency of A&C-BEs at 21 endogenous target sites in HEK293T cells. Data are means � SD (n = 3 independent experiments). h Frequency of A/C simultaneous conversion induced by A&C-BEmax, eA&C-BEmax, and hyA&C-BEmax at 21 endogenous genomic loci in b and Supplementary Fig. 3b. i Number of mutant allele types formation by A&C-BEmax, eA&C-BEmax or hyA&C-BEmax at 21 endogenous genomic loci in b and Supplementary Fig. 3b. j Frequency of indels formation by A&C-BEmax, eA&C-BEmax or hyA&C-BEmax at 21 endogenous genomic loci in b and Supplementary Fig. 3b. For c, d, Each data point represents means at indicated target sites from 3 independent experiments. For h?j, Each data point represents means at indicated target sites calculated from 3 independent experiments. Significance was tested with two-tailed Student?s t test (e?g) or two-sided paired Wilcoxon rank-sim test (c, d and h?j). Source data are provided as a Source Data file. |
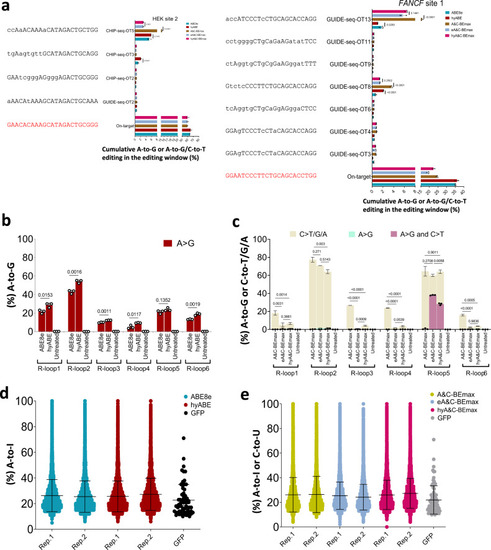
Off-target assessments of hyper ABE and hyper A&C-BEmax.
a Cas9-dependent DNA on and off-target analysis of the indicated targets (HEK site 2 and FANCF site 1) by ABE8e, hyABE, A&C-BEmax, eA&C-BEmax and hyA&C-BEmax in HEK293T cells. Lowercase protospacer sequences represent mismatched bases compared to their corresponding on-target sequences. Data are means � SD (n = 3 independent experiments). b, c Cas9-independent DNA off-target analysis of ABE8e, hyABE, A&C-BEmax, eA&C-BEmax, and hyA&C-BEmax using the modified orthogonal R-loop assay at each R-loop site with nSaCas9-sgRNA. Data are means � SD (n = 3 independent experiments). d, e RNA off-target editing activity by ABE8e, hyABE, A&C-BEmax, eA&C-BEmax and hyA&C-BEmax using RNA-seq. Each biological replicate is listed on the bottom. For a?c, significance was tested by two-tailed Student?s t test. Source data are provided as a Source Data file. |
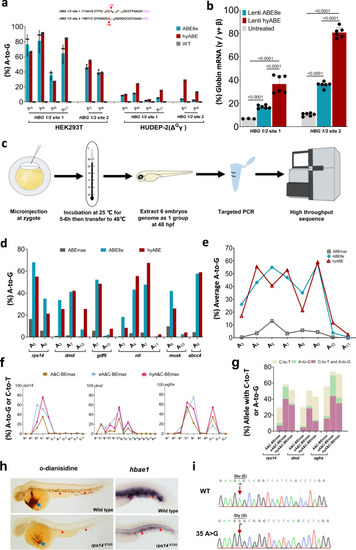
Efficiently install therapeutic mutations and generate zebrafish mutants with hyper BEs.
a The comparison of base editing efficiency by ABE8e and hyABE at HBG 1/2 ?113 A-to-G or ?198 T-to-C in HEK293T cells and HUDEP-2 (?G?) cells. Data are means � SD (n = 3 independent experiments). b Comparison of ?-globin mRNA expression relative to ?-like globin mRNA via hyABE treatment in HUDEP-2 (?G?) cells after differentiation. Data are means � SD (n = 3 for one untreated group and n = 6 for the other untreated or treated group). P value was determined by two-tailed Student?s t-test. c The flow chart for generating zebrafish mutants with hyABE and hyA&C-BEmax. d The A-to-G base editing efficiency of hyABE, ABE8e or ABEmax at endogenous target sites for ntl, dmd, musk, rps14, gdf6 and abcc4 in zebrafish embryos. e The average A-to-G editing efficiency of hyABE, ABE8e, or ABEmax across protospacers at the endogenous targets shown in b. f The A-to-G or C-to-T editing efficiency of A&C-BEmax, eA&C-BEmax or hyA&C-BEmax was examined at 3 endogenous target sites in zebrafish embryo. g The composition of A&C-BEmax, eA&C-BEmax and hyA&C-BEmax base editing products at 3 endogenous zebrafish genomic loci. The individual data are shown as yellow (only C-to-T), green (only A-to-G) and plum purple (simultaneous C-to-T and A-to-G) columns. h The hematopoietic phenotypes of rps14E12G embryos. O-dianisidine staining exhibits a reduction of erythrocytes at the yolk sac (blue arrow) and the trunk region (red triangle) in rps14E12G embryos compared to wild-type (WT) control embryos at 48 hpf (left). WISH analysis for hbae1 expression (red triangle) in rps14E12G mutant embryos and WT control embryos at 72 hpf (right). i Sanger sequencing chromatograms of DNA from a WT embryo and a single F0 rps14E12G embryo carrying the A to G conversion at the nucleotide 35 (arrow) that causes Glu (E) to Gly (G) substitution (Red arrow). Source data are provided as a Source Data file. |