
- Title
-
Ependymal polarity defects coupled with disorganized ciliary beating drive abnormal cerebrospinal fluid flow and spine curvature in zebrafish
- Authors
- Xie, H., Kang, Y., Liu, J., Huang, M., Dai, Z., Shi, J., Wang, S., Li, L., Li, Y., Zheng, P., Sun, Y., Han, Q., Zhang, J., Zhu, Z., Xu, L., Yelick, P.C., Cao, M., Zhao, C.
- Source
- Full text @ PLoS Biol.
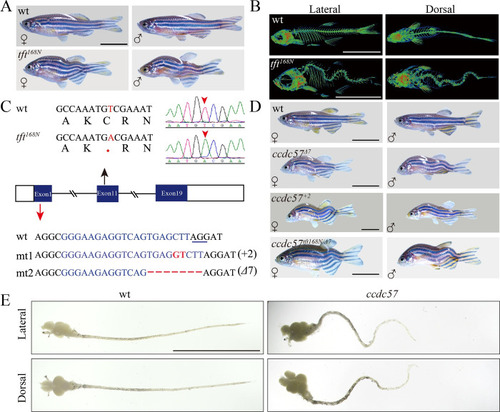
Mutation of ccdc57 leads to scoliosis.
(A) Representative images of male and female wild type and tft168N mutants. (B) Micro-CT images showing lateral and dorsal views of 3-months-old wild type and tft168N mutants. (C) Genomic structure and sequences of wild type, tft168N mutant and two ccdc57 mutant alleles generated with CRISPR/Cas9. The underlined sequence in wt indicates PAM sequence of sgRNA target. (D) Representative images of male and female wild type and ccdc57 mutants with different genetic background as indicated. (E) The dissected brain and spinal cord in wild type and ccdc57 mutant. Scale bars: 1 cm in panels A, B, D, E. PHENOTYPE:
|
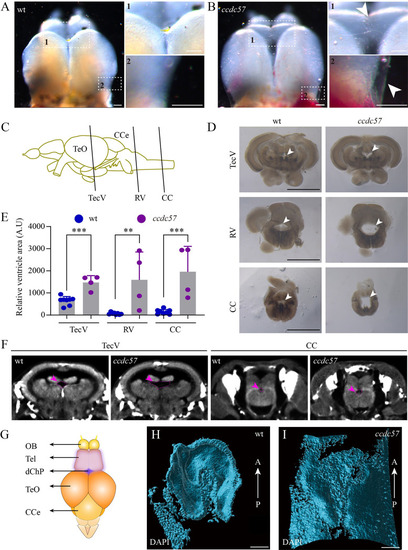
Hydrocephalus in ccdc57 mutants.
(A, B) External phenotypes of telencephalons in wild type and ccdc57 mutant. Arrows point to the expanded ependymal epithelia due to excess CSF accumulation. (C) Diagram of the brain tissue in zebrafish showing the sites of crossing section in different ventricles. CCe, corpus cerebelli; TeO, tectum opticum; CC, central canal; TecV, tectal ventricle; RV, rhombencephalic ventricle. (D) Histological cross-sections showing ventricles (arrows) at different sites as indicated. (E) Bar graph showing relative size of brain ventricles at different sites as indicated. (F) Micro-CT images showing the ventricles (arrows) in TecV and CC of wild type and mutant. (G) Diagram showing the position of diencephalic choroid plexus (dChP) in adult zebrafish. OB, olfactory bulb; Tel, telencephalon. (H, I) Three-dimensional reconstruction of dChP visualized with DAPI staining in wild type and ccdc57 mutant. These still images are from S1 Movie and visualized from ventral side of the dChP. A, anterior; P, posterior. Scale bars: 100 μm in panels A and B, 1 mm in panel D, and 50 μm in panels H and I. The data underlying the graphs shown in the figure can be found in S1 Data. PHENOTYPE:
|

Mutation of ccdc57 results in planar polarity defects in ependymal cells.
(A) Still images showing the beating direction of motile cilia to drive fluid flow (pink arrow) in adult wild type and mutants. The representative kymographs of cilia movement were shown at the bottom. (B) Scanning electron microscopy showing the multicilia of the ependymal cells in wild type and ccdc57 mutant. (C) Confocal images showing cilia of the ependymal cells in wild type and ccdc57 mutant as indicated. Cilia were labeled with anti-mono-glycylated tubulin in green and the tight junction were stained with Claudin-5 antibody in red. Nuclei were counterstained with DAPI. (D) Confocal images showing the basal body distribution in the ependymal cells of wild type and ccdc57 mutant as indicated. The basal bodies were labeled with anti-γ tubulin in green and cytoskeleton was stained with phalloidin in purple. Tight junctions were stained with Claudin-5 antibody in red. Nuclei were counterstained with DAPI. Arrows indicate the displacement of basal bodies from the center of the cells. The schematic diagram of the displacement of basal bodies were shown at the bottom. (E) Angular distribution of the basal bodies in ependymal cells from wild type and ccdc57 mutant. (F) Statistical analysis showing relative displacement distance of basal bodies from center of the cell. (G) Statistical analysis showing the number of basal bodies in each ependymal cell of wild type and ccdc57 mutant. BB, basal body. (H) Model illustrating the distribution of multicilia on ependymal cells of wild type and ccdc57 mutant. All the data analyzed in this figure are generated from 3- to 4-months-old adult zebrafish. Scale bars: 5 μm in panels B and D; 7.5 μm in panel C. The data underlying the graphs shown in the figure can be found in S1 Data. |

Loss of Ccdc57 results in ependymal cell polarity defects.
(A, B) Distribution pattern of ependymal cells in 3-months-old wild type and ccdc57 mutant as indicated with tight junction marker Claudin-5 staining. Nuclei were counterstained with DAPI in blue. The displayed region of ependymal epithelia was indicated in panel A. Heatmap showing the relative size of each ependymal cells as displayed in the confocal images. (C) Statistical analysis showing orientation of the midline ependymal cells along the anterior–posterior (A–P) axis in wild type and ccdc57 mutant. The angles between the longer axis of each midline ependymal cells and the A–P axis were used to evaluate cell polarity with 0 degree indicating horizontal cell. (D, E) Distribution pattern of ependymal cells in the brains of 17 dpf wild type and ccdc57 mutant. (F) Statistical analysis showing orientation of the midline ependymal cells in wild type and mutant as indicated. (G) Confocal images showing the ependymal layer labeled with Claudin-5 (red) and glycylated tubulin (green) antibodies in 25 and 30 dpf wt and ccdc57 mutants. Enlarged views of the boxed regions are displayed in the bottom. Nuclei were counterstained with DAPI. Scale bars: 25 μm in panel B; 50 μm in panel E; 50 μm in panel G. The data underlying the graphs shown in the figure can be found in S1 Data. EXPRESSION / LABELING:
PHENOTYPE:
|
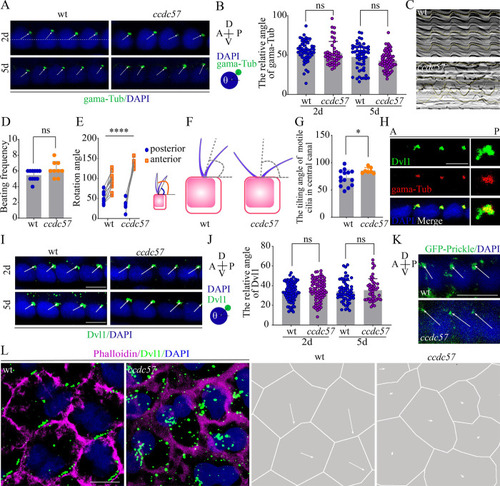
Ccdc57 orchestrates synchronized beating of motile cilia in the central canal.
(A) Confocal images showing the localization of basal bodies in the floor plate cells at 2 dpf and 5 dpf. Basal bodies were stained with anti-γ tubulin (gama-Tub, green) antibody, and nuclei were counterstained with DAPI in blue. The white dotted line connects the center of cells. (B) Statistical analysis showing the angles of basal bodies with the anterior–posterior (A–P) axis as illustrated in the diagram. (C) Still images showing kymographs of floor plate cilia movement in 5 dpf of wild type and ccdc57 mutant. (D) Beating frequency of floor plate cilia in wild type and ccdc57 mutants. (E) Statistical analysis showing the rotation angles of cilia in floor plate. The anterior and posterior angles were measured as illustrated in the diagram. (F, G) Relative tilting directions of floor plate cilia in wild type and ccdc57 mutants. The tilting direction was evaluated by the bisector of each angles. (H) Confocal images showing relative localization of Dvl protein (green) and basal body (gama-Tub, red) in floor plate cells. (I, J) Subcellular localization of Dvl protein (green) in the floor plate ependymal cells. The statistical results were shown in panel J. (K) Confocal images showing the localization of GFP-Prickle (green) in floor plate ependymal cells as indicated. (L) Confocal images showing the distribution of Dvl protein (green) on ependymal cells of adult zebrafish. The displacement distance of Dvl vesicles was also shown on the right. Scale bars: 5 μm in panel A; 5 μm in panels H and I; 10 μm in panel K; 7.5 μm in panel L. The data underlying the graphs shown in the figure can be found in S1 Data. |
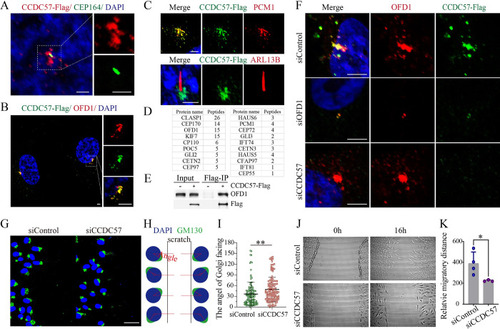
CCDC57 is a centrosomal satellite protein required for cell polarity.
(A-C) Confocal images showing the relative localization of CCDC57 with OFD1, PCM1, CEP164, and ARL13B in RPE-1 cells. (D) Mass spectrometry analysis of the CCDC57 interacting proteins. (E) Immunoprecipitation results showing the interaction between CCDC57 and OFD1. (F) Confocal images showing the localization of CCDC57 and OFD1 in siRNA knockdown RPE-1 cells. (G) Scratch-wound assay showing the polarized localization of Golgi (GM130, green) during directional cell migration in control and CCDC57 siRNA-treated cells. (H) Model illustrating the statistical analysis of cell polarity by Golgi position. (I) Dot plots showing the angles of Golgi facing the migration edge in control and CCDC57 siRNA-treated cells. (J, K) Images showing the cell migration state and statistical analysis of the migration distance. In all panels, nuclei were counterstained with DAPI in blue. Scale bars: 2.5 μm in panel A; 5 μm in panel B; 3 μm in panel C; 5 μm in panel F; 50 μm in panel G. The data underlying the graphs shown in the figure can be found in S1 Data. |
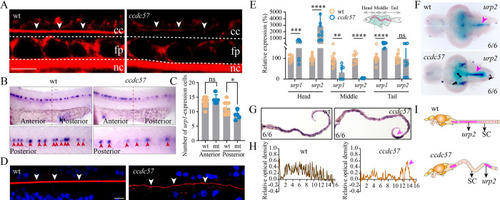
Mutation of ccdc57 results in RF defects and abnormal expression of Urotensins in the spinal cord.
(A) Representative images of Reissner fiber (RF, white arrows) in 2 dpf wild type and ccdc57 mutant larvae. cc, central canal; nc, notochord; fp, floor plate. (B) Whole-mount in situ hybridization results showing the expression of urp1 in 24 hpf control and ccdc57 mutant larvae as indicated. The enlarged views of the staining in the posterior region are shown in the bottom. (C) Statistical analysis showing the number of urp1-expressing cells in the anterior and posterior part of the trunk. (D) Confocal images showing RF (white arrow) in wild type and ccdc57 adult mutants. RF was stained with wheat germ agglutinin (WGA, red), and nuclei were counterstained with DAPI. (E) qPCR analysis showing the expression of urotensin genes (urp1 and urp2) in different parts of the adult trunk as illustrated in the diagram. (F) In situ hybridization results showing the expression of urp2 in the brains of adult wild type and ccdc57 mutant as indicated. Arrows point to the expression of urp2 in the posterior part of the brain. (G) In situ hybridization results showing the expression of urp2 in the spinal cord of wild type and ccdc57 mutant as indicated. The purple arrowhead indicates the sites of enriched urp2 expression. (H) The line graphs showing the relative optical density of the expression of urp2 in wild type and ccdc57 mutants. (I) Model illustrating the distribution of urp2 in wild type and ccdc57 mutant. Scale bars: 7.5 μm in panel A; 10 μm in panel D. The data underlying the graphs shown in the figure can be found in S1 Data. |
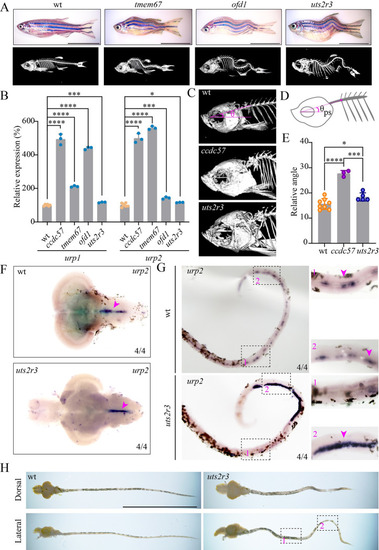
Ectopic accumulation of urotensin neuropeptides is associated with spine curvature in zebrafish ciliary mutants.
(A) Representative images of wild type and scoliosis zebrafish mutants. Micro-CT images are shown on the bottom. (B) qPCR analysis showing the expression of urotensin genes in the heads of wild type and scoliosis mutants. (C) Enlarged views of the head regions of wild type, ccdc57, and uts2r3 mutants. (D, E) Statistical analysis of the dorsal curvature angles in different mutants as indicated. The angles were measured between the direction of the parasphenoid bone and the Weberian vertebrae as illustrated in the diagram (D). (F) In situ hybridization results showing the expression of urp2 in the brains of wild type and uts2r3 mutant as indicated. (G) Expression of urp2 in the spinal cords of wild type and uts2r3 mutant. The strongly increased expression of the urp2 in the tail region was shown on the enlarged views. (H) Dissected spinal cords from wild type and uts2r3 mutants as indicated. The two boxed regions correspond to those in panel G. Scale bars: 1 cm in panels A and H. The data underlying the graphs shown in the figure can be found in S1 Data. |

Abnormal urotensin signals in adolescent idiopathic scoliosis (AIS) patients.
(A) Diagram indicating the position of bilateral paravertebral muscles harvested from AIS patients. (B, C) Relative expression of UTS2R and UTS2 in bilateral paravertebral muscles of AIS patients (n = 46). (D) Distribution of Cobb angles within the two groups of AIS patients exhibiting a ratio of UTS2R expression on the convex versus concave sides greater (>) or less (<) than 2. (E) Representative X-ray images showing two AIS patients with convex/concave ratios greater (5.21) or less than 2 (1.24). Measurements of Cobb angles are also indicated. The data underlying the graphs shown in the figure can be found in S1 Data. |