
|
Fig 8
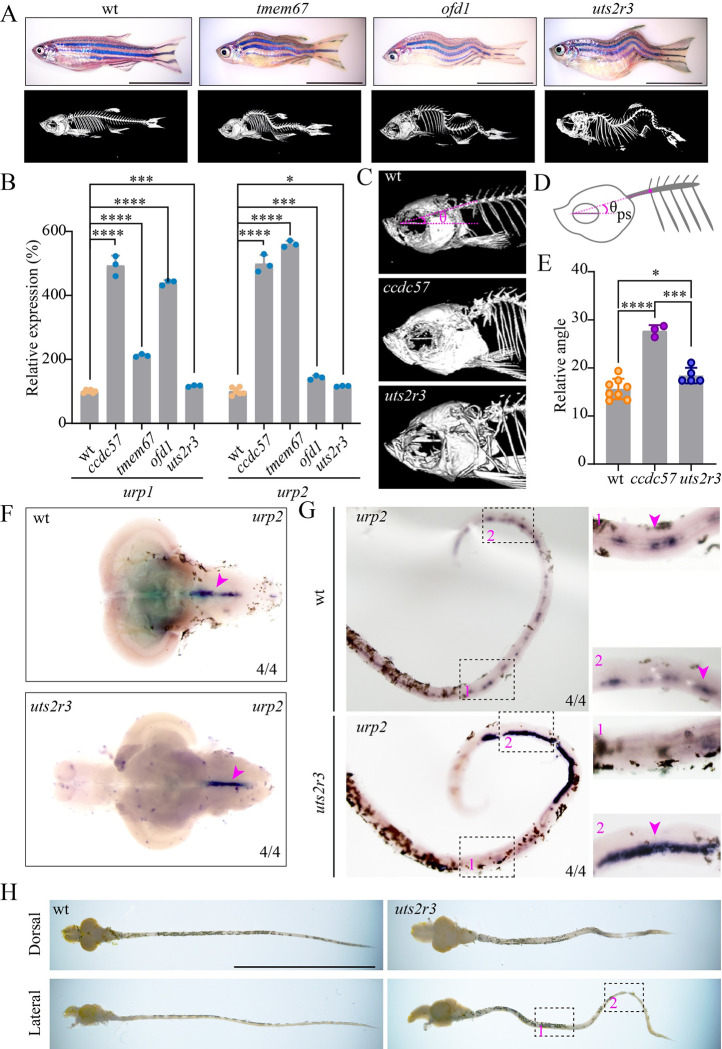
(A) Representative images of wild type and scoliosis zebrafish mutants. Micro-CT images are shown on the bottom. (B) qPCR analysis showing the expression of urotensin genes in the heads of wild type and scoliosis mutants. (C) Enlarged views of the head regions of wild type, ccdc57, and uts2r3 mutants. (D, E) Statistical analysis of the dorsal curvature angles in different mutants as indicated. The angles were measured between the direction of the parasphenoid bone and the Weberian vertebrae as illustrated in the diagram (D). (F) In situ hybridization results showing the expression of urp2 in the brains of wild type and uts2r3 mutant as indicated. (G) Expression of urp2 in the spinal cords of wild type and uts2r3 mutant. The strongly increased expression of the urp2 in the tail region was shown on the enlarged views. (H) Dissected spinal cords from wild type and uts2r3 mutants as indicated. The two boxed regions correspond to those in panel G. Scale bars: 1 cm in panels A and H. The data underlying the graphs shown in the figure can be found in S1 Data.