
- Title
-
Gata2a Mutation Causes Progressive Microphthalmia and Blindness in Nile Tilapia
- Authors
- Liu, X., Zhou, L., Li, W., Wu, J., Wang, D.
- Source
- Full text @ Int. J. Mol. Sci.
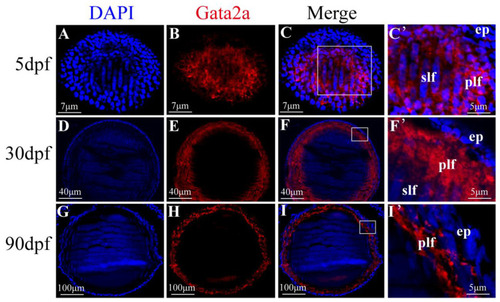
Expression pattern of Gata2a in the lens of Nile tilapia at different developmental stages. (A–C’) Expression of Gata2a was detected in the fiber cell mass of the lens from larvae at 5 dpf. (D–F’) Gata2a expression was detected in the nucleus of primary and secondary (anterior and posterior elongating) lens fiber cells, most prominently in the primary lens fiber cell near the equatorial zone where differentiation first initiates, from juvenile at 30 dpf. (G–I’) Gata2a was consistently detected in the nuclei of primary fiber cells along the equatorial zone of the lens at 90 dpf. (C’,F’) was the higher magnification fluorescent micrograph of the boxed region shown in (C,F), respectively. dpf: day post fertilization. ep: epithelial cell; plf: primary lens fiber cell; slf: secondary lens fiber cell. |

Generation of tilapia gata2a mutant line by CRISPR/Cas9. (A) Schematic diagram showing gata2a gene structure and sgRNA target site near the translation start site on the antisense strand. (B,C) Generation of the gata2a mutant line. Mutations at the gata2a locus were analyzed by restriction enzyme digestion (B) and DNA sequencing (C). Deletions are indicated by dashes (C). The numbers in brackets represent the bases deleted/inserted from each allele. (D) Identification of F2 genotypes by restriction enzyme digestion assay. Homozygous mutants with different mutation types (+5 bp and −7 bp) were obtained. (E) Sequencing results of the gata2a gene from WT and homozygous mutant fish. (F) Western blot was carried out to show the specificity of the antibody against Gata2a. (G) Immunofluorescence was used to test the specificity of the Gata2a antibody. Scale bar: 50 μm. M, marker; PAM, protospacer adjacent motif. |
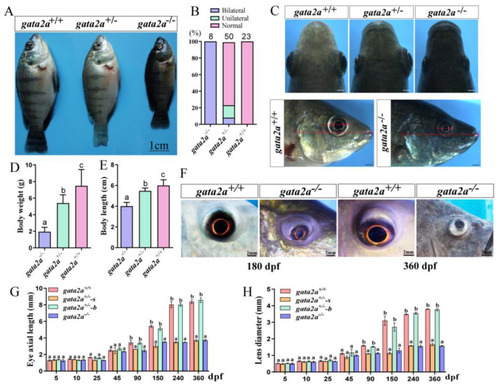
Morphological analysis of tilapia gata2a mutants at 90 dpf. (A) Morphology of gata2a mutants. (B) Proportions of the fish with microphthalmia in the F2 generation. (C) Eyes morphology of the gata2a mutants at 90 dpf. The presence of small eyes on the left or right side is random in gata2a+/− fish. (D,E) Body weight and body length (sample size: homozygous mutants, n = 8, heterozygous mutants, n = 50, wt, n = 23). (F) Eye morphology of gata2a homozygous mutants at 180 and 360 dpf. (G,H) Eyes axial length and lens diameter. Data are expressed as the mean ± SD. One-way ANOVA was performed followed by Tukey’s test. Different letters above the error bar indicate significant differences at p < 0.05. dpf: day post fertilization. “gata2a+/−-s” and “gata2a+/−-b” represents eyes from gata2a heterozygous mutants with unilateral micropgthalmia (s, small eye; b, big eye). |
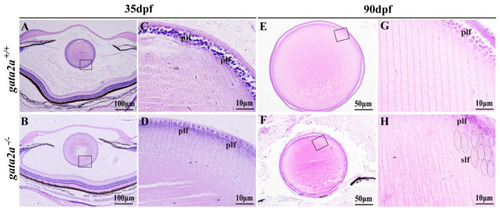
Histological analysis of the eyes from WT and gata2a mutants at 35 and 90 dpf. (A–D) Histology of the eyes at 35 dpf, the size of the lens from gata2a mutants were similar to that of WT (A,B), while most of the primary lens fiber cells were degenerated (C,D). (E–H) Lens from gata2a mutants were smaller and opaque compared to those from WT siblings (E,F). Most of the primary lens fiber cells in the gata2a mutants were degenerated, and the nuclei were not degraded in some of the secondary lens fiber cells (G,H). (C,D,G,H) are magnifications of the boxed areas in (A,B,G,H), respectively. dpf: day post fertilization. plf: primary lens fiber cell; slf: secondary lens fiber cell. The dotted circles and ellipses in the (H) diagram represent primary and secondary lens fiber cells, respectively. |
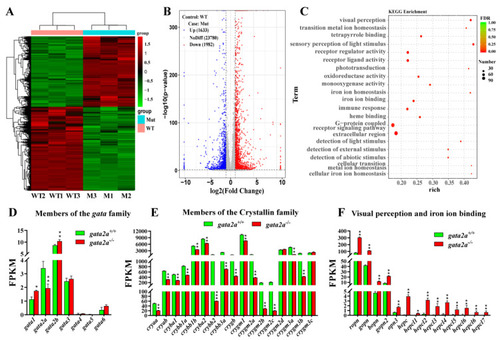
Comparative transcriptomic analysis of genes and molecular pathways dysregulated in gata2a−/− eyes. (A) Heatmap displaying difference in gene expression between eyes from WT (gata2a+/+) and gata2a mutants (gata2a−/−) at 35 dpf. (B) Volcanic map of differentially expressed genes (DEGs) between the eyes from WT and gata2a mutants. A total of 1982 and 1633 genes were downregulated and upregulated, respectively, in the eyes from gata2a mutants compared with the eyes from WT fish. (C) Scatter plot of the enriched KEGG pathways for the DEGs. The sizes and colors of the dots represent the number of genes and the significance of the difference, respectively. (D) Effects of gata2a mutation on gene expression of the gata family. (E,F) Gata2a mutation down-regulated crystallin family genes (E), and up-regulated visual perception and iron ion binding-related genes (F) in the eyes. Data were presented as the mean ± SD of triplicates. Differences between groups were statistically examined with two-tailed unpaired Student’s t-test. Significant difference is denoted by * (p < 0.01), ** (p < 0.001) and *** (p < 0.0001). |