
|
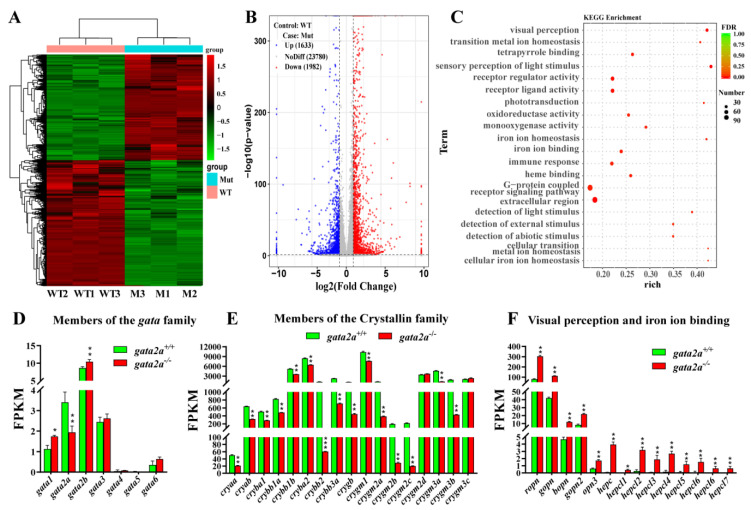
Figure 5
Comparative transcriptomic analysis of genes and molecular pathways dysregulated in gata2a−/− eyes. (A) Heatmap displaying difference in gene expression between eyes from WT (gata2a+/+) and gata2a mutants (gata2a−/−) at 35 dpf. (B) Volcanic map of differentially expressed genes (DEGs) between the eyes from WT and gata2a mutants. A total of 1982 and 1633 genes were downregulated and upregulated, respectively, in the eyes from gata2a mutants compared with the eyes from WT fish. (C) Scatter plot of the enriched KEGG pathways for the DEGs. The sizes and colors of the dots represent the number of genes and the significance of the difference, respectively. (D) Effects of gata2a mutation on gene expression of the gata family. (E,F) Gata2a mutation down-regulated crystallin family genes (E), and up-regulated visual perception and iron ion binding-related genes (F) in the eyes. Data were presented as the mean ± SD of triplicates. Differences between groups were statistically examined with two-tailed unpaired Student’s t-test. Significant difference is denoted by * (p < 0.01), ** (p < 0.001) and *** (p < 0.0001).