
- Title
-
L-selenomethionine affects liver development and glucolipid metabolism by inhibiting autophagy in zebrafish embryos
- Authors
- Zhu, Y., Hu, J., Zeng, S., Gao, M., Guo, S., Wang, M., Hong, Y., Zhao, G.
- Source
- Full text @ Ecotoxicol. Environ. Saf.
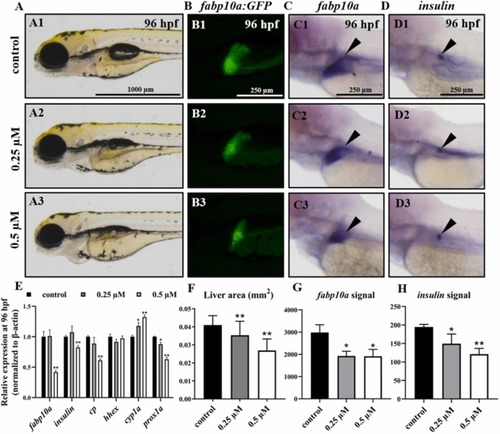
Fig. 1. Toxic effect of selenium at different concentrations on liver development of zebrafish embryos. (A) Lateral views of control group (A1) and selenium-treated groups (A2, A3) at 96 hpf. (B) Liver area of fabp10a-eGFP transgenic zebrafish in control group (B1) and selenium-treated groups (B2, B3). (C, D) Distribution of genes fabp10a (C1-C3) and insulin (D1-D3) in selenium-treated groups at 96 hpf. (Black arrowhead indicates WISH signal area) (E) Expressions of genes fabp10a, insulin, cp, hhex, cyp1a, prox1a at 96 hpf by qRT-PCR. (F) Liver area at 96 hpf. (G, H) Quantification analysis of the WISH data in different groups. (**) p<0.01, (*) p<0.05. |
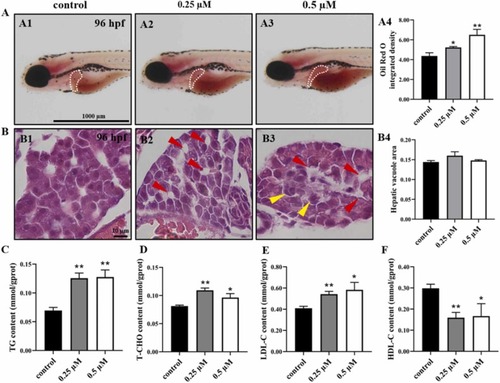
Fig. 2. Toxic effect of selenium at different concentrations on lipid metabolism of zebrafish embryos. (A) Effects of selenium on Oil Red O staining in control group (A1) and selenium-treated groups (A2, A3) at 96 hpf. Oil Red O staining integrated density of the liver in zebrafish embryos (A4). (B) H&E staining analysis of embryonic liver sections in control group (B1) and selenium-treated groups (B2, B3) at 96 hpf (Red arrowheads indicate hepatic vacuole, yellow arrowheads indicate irregularly hepatocytes). Relative areas for hepatic vacuole in H&E staining (B4). Changes of triglyceride (TG) (C), total cholesterol (T-CHO) (D), low-density lipoprotein cholesterol (LDL-C) (E), and high-density lipoprotein cholesterol (HDL-C) (F) in control and selenium-treated groups at 96 hpf. (**) p<0.01, (*) p<0.05. |
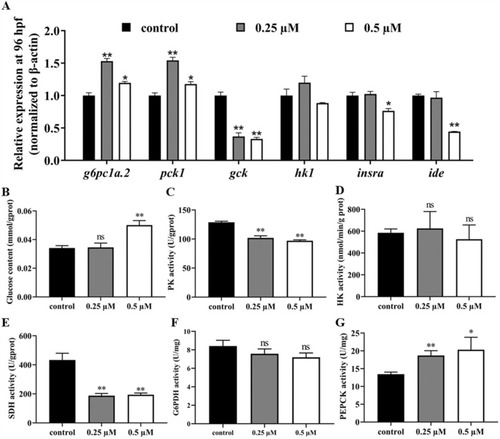
Fig. 3. Toxic effect of selenium at different concentrations on glucose metabolism of zebrafish embryos. (A) Expressions of glucose metabolism-related genes in embryos stressed with selenium. Changes of glucose content (B), pyruvate kinase (PK) (C), hexokinase (HK) (D), succinate dehydrogenase (SDH) (E), 6-phosphate glucose dehydrogenase (G6PDH) (F), and phosphoenolpyruvate carboxylase kinase (PEPCK) activity (G) in the control and selenium-treated groups at 96 hpf. (**) p<0.01, (*) p<0.05. |

Fig. 4. Autophagy dysfunction and oxidative stress in zebrafish embryos. (A) Expressions of autophagy-related genes in the control and selenium-treated groups at 96 hpf. (B) TEM analysis of mitochondria of liver sections in control group (B1) and selenium‐stressed groups (B2, B3) at 96 hpf. (C) TEM analysis of hepatic cells in control group (C1, C2) and selenium‐stressed groups (C3-C6) at 96 hpf. (Red arrowheads indicate autolysosome, yellow arrowheads indicate autophagosome with double membrane, blue arrowheads indicate double membrane, blue arrowhead indicate autophagosome being engulfed progress) (D) Expression changes of LC3B in zebrafish liver in the control group (D1-D3) and selenium-stressed groups at 96 hpf (D4-D9). (**) p<0.01, (*) p<0.05. |

Fig. 5. Effect of autophagy inducer (rapamycin) on selenium-induced hepatic defects. (A) Lateral views of selenium-rapamycin co-treated embryos at 96 hpf. (B) Liver area of fabp10a-eGFP transgenic zebrafish in the control group (B1), rapamycin-treated group (B2), selenium-treated group (B3), and selenium-rapamycin co-treated group (B4) at 96 hpf. (C) Developmental malformation of selenium and selenium-rapamycin co-treated zebrafish embryos at 96 hpf. (D) Measurement of liver area in control, selenium, rapamycin, and selenium-rapamycin co-treated group. (**) p<0.01, (*) p<0.05. |
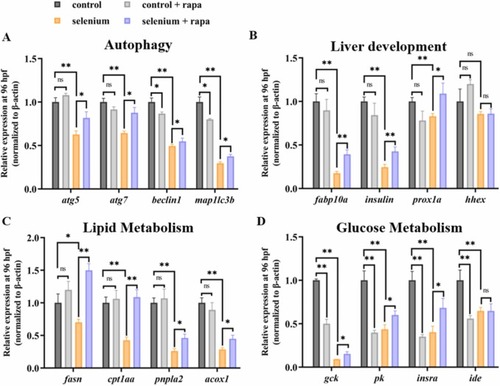
Fig. 6. Expression of autophagy-related genes (A), liver developmental genes (B), lipid-metabolism related genes (C), and glucose-metabolism related genes (D) in the control, selenium, rapamycin, and selenium-rapamycin co-treated group at 96 hpf. (**) p<0.01, (*) p<0.05. |