
|
Fig. 2
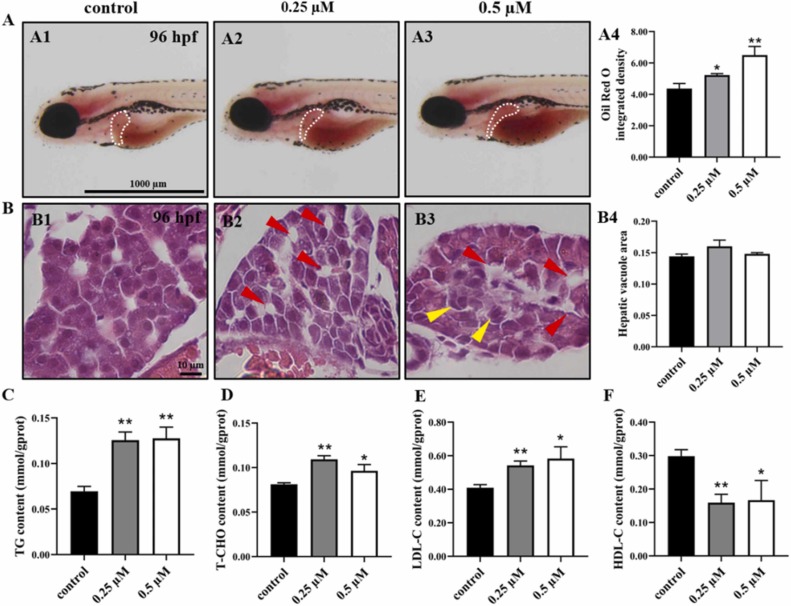
Fig. 2. Toxic effect of selenium at different concentrations on lipid metabolism of zebrafish embryos. (A) Effects of selenium on Oil Red O staining in control group (A1) and selenium-treated groups (A2, A3) at 96 hpf. Oil Red O staining integrated density of the liver in zebrafish embryos (A4). (B) H&E staining analysis of embryonic liver sections in control group (B1) and selenium-treated groups (B2, B3) at 96 hpf (Red arrowheads indicate hepatic vacuole, yellow arrowheads indicate irregularly hepatocytes). Relative areas for hepatic vacuole in H&E staining (B4). Changes of triglyceride (TG) (C), total cholesterol (T-CHO) (D), low-density lipoprotein cholesterol (LDL-C) (E), and high-density lipoprotein cholesterol (HDL-C) (F) in control and selenium-treated groups at 96 hpf. (**) p<0.01, (*) p<0.05.