
|
Fig. 1
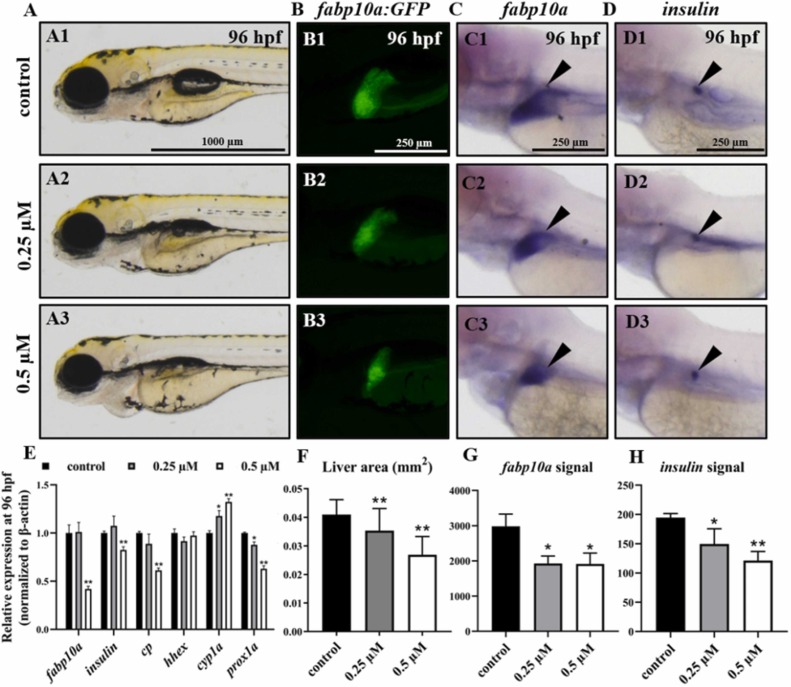
Fig. 1. Toxic effect of selenium at different concentrations on liver development of zebrafish embryos. (A) Lateral views of control group (A1) and selenium-treated groups (A2, A3) at 96 hpf. (B) Liver area of fabp10a-eGFP transgenic zebrafish in control group (B1) and selenium-treated groups (B2, B3). (C, D) Distribution of genes fabp10a (C1-C3) and insulin (D1-D3) in selenium-treated groups at 96 hpf. (Black arrowhead indicates WISH signal area) (E) Expressions of genes fabp10a, insulin, cp, hhex, cyp1a, prox1a at 96 hpf by qRT-PCR. (F) Liver area at 96 hpf. (G, H) Quantification analysis of the WISH data in different groups. (**) p<0.01, (*) p<0.05.