
Image
|
Figure Caption
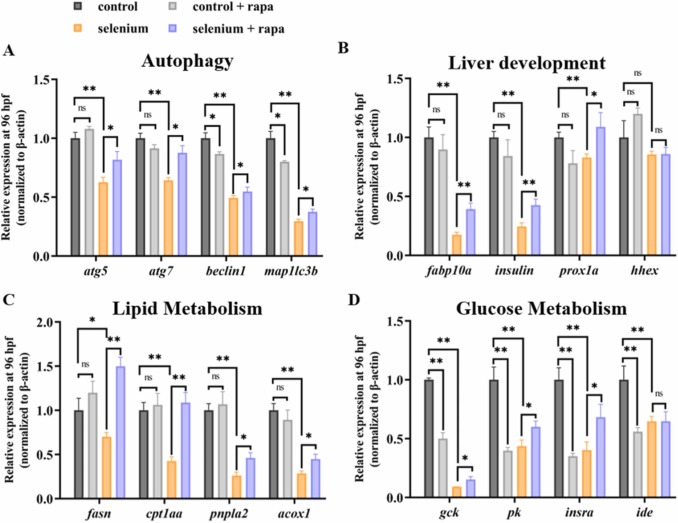
Fig. 6
Fig. 6. Expression of autophagy-related genes (A), liver developmental genes (B), lipid-metabolism related genes (C), and glucose-metabolism related genes (D) in the control, selenium, rapamycin, and selenium-rapamycin co-treated group at 96 hpf. (**) p<0.01, (*) p<0.05.
Acknowledgments
This image is the copyrighted work of the attributed author or publisher, and
ZFIN has permission only to display this image to its users.
Additional permissions should be obtained from the applicable author or publisher of the image.
Full text @ Ecotoxicol. Environ. Saf.