
|
Fig. 4
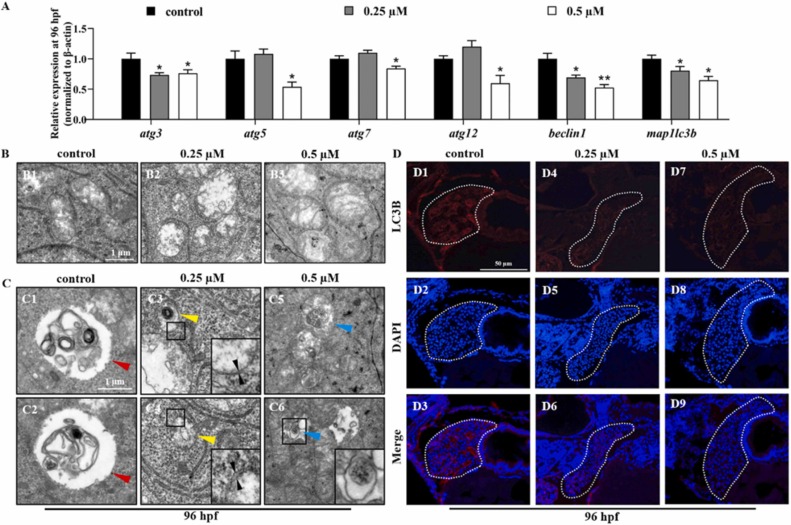
Fig. 4. Autophagy dysfunction and oxidative stress in zebrafish embryos. (A) Expressions of autophagy-related genes in the control and selenium-treated groups at 96 hpf. (B) TEM analysis of mitochondria of liver sections in control group (B1) and selenium‐stressed groups (B2, B3) at 96 hpf. (C) TEM analysis of hepatic cells in control group (C1, C2) and selenium‐stressed groups (C3-C6) at 96 hpf. (Red arrowheads indicate autolysosome, yellow arrowheads indicate autophagosome with double membrane, blue arrowheads indicate double membrane, blue arrowhead indicate autophagosome being engulfed progress) (D) Expression changes of LC3B in zebrafish liver in the control group (D1-D3) and selenium-stressed groups at 96 hpf (D4-D9). (**) p<0.01, (*) p<0.05.