
- Title
-
Predicting Modifiers of Genotype-Phenotype Correlations in Craniofacial Development
- Authors
- Kar, R.D., Eberhart, J.K.
- Source
- Full text @ Int. J. Mol. Sci.
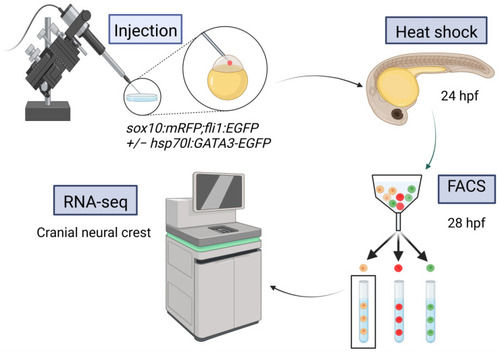
Experimental protocol for RNA-seq. Created with BioRender.com (accessed on 21 November 2022). |

Changes in gata3 expression drive differential regulation. (A) A subset of differentially expressed genes which had directionally discordant changes between the knockdown and rescue groups (relative to the control) were selected for further bioinformatic analysis. (B) There were 551 differentially regulated genes selected for analysis. (C) The five most upregulated genes in the knockdown group. (D) The five most down regulated genes in the knockdown group. |
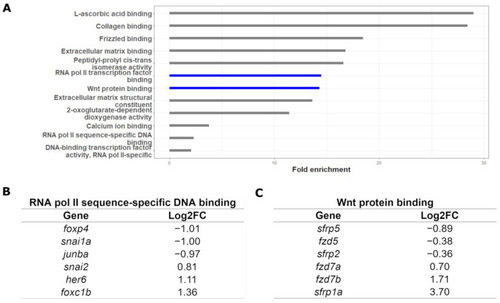
GO analysis of RNA-seq dataset. (A) Wnt protein binding and RNA polymerase II transcription-factor binding processes were highly overrepresented. (B) Representative genes from the “RNA polymerase II sequence-specific DNA binding” term. (C) Representative genes from the “Wnt protein binding” term. |

Gata3 dataset yields chemical modifiers via LINCS. The top 100 up- and down-regulated genes affected by gata3 knockdown and rescue were queried against the LINCS L1000 dataset. The chemical modifiers whose profile most resembled the transcriptomic signature were selected for testing. Modifiers that significantly reduced the intact trabeculae count in mild mutant phenotype are listed under “enhances phenotype”, while those that significantly increased the trabeculae count in the severe mutant phenotype are listed under “suppresses phenotype”. Created with BioRender.com. |
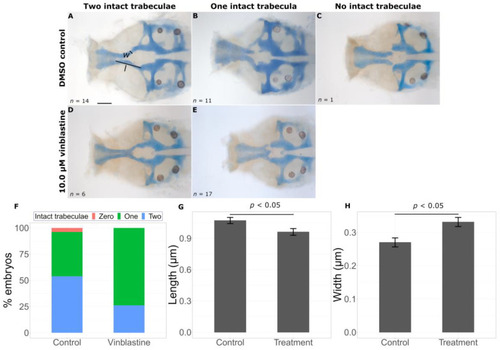
Vinblastine exacerbates the gata3 mutant phenotype. Representative flat mounts show the range of defects in DMSO treated (A–C) and vinblastine treated (D, |
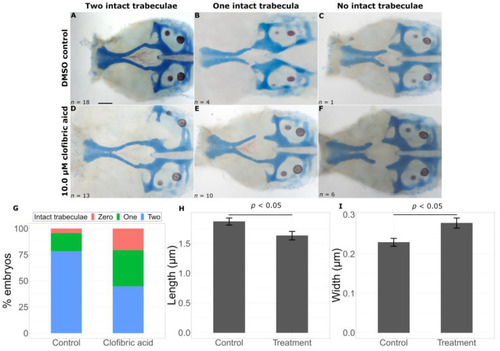
Clofibric acid worsens the gata3 mutant phenotype. Representative flat mounts show defects in the trabeculae with DMSO treatment ( |
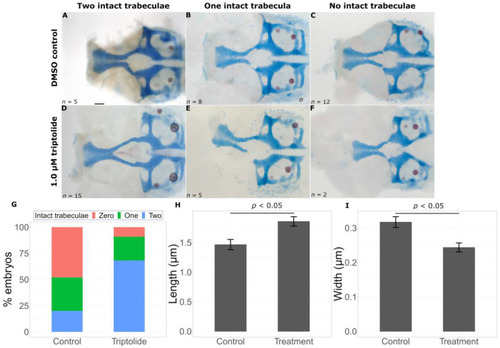
Triptolide suppresses the gata3 mutant phenotype. Representative flat mounts show breaks in the trabeculae with DMSO treatment (A–C) and chemical treatment (D–F). Triptolide treatment leads to a statistically significant increase in intact trabeculae count ((G), p < 0.05), an increase in trabeculae length ((H), p < 0.05) and a decrease in trabeculae width ((I), p < 0.05). Error bars represent SEM. Scale bar = 0.5 μm. |
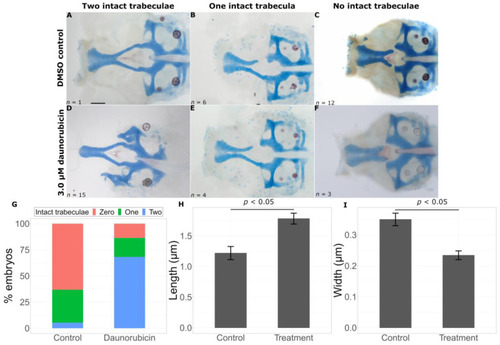
Daunorubicin suppresses the gata3 mutant phenotype. Representative flat mounts show breaks in the trabeculae with DMSO treatment (A–C) and chemical treatment (D–F). Daunorubicin treatment leads to a statistically significant increase in intact trabeculae count ((G), p < 0.05), an increase in trabeculae length ((H), p < 0.05) and a decrease in trabeculae width ((I), p < 0.05). Error bars represent SEM. Scale bar = 0.5 μm. |