
Image
|
Figure Caption
Figure 2
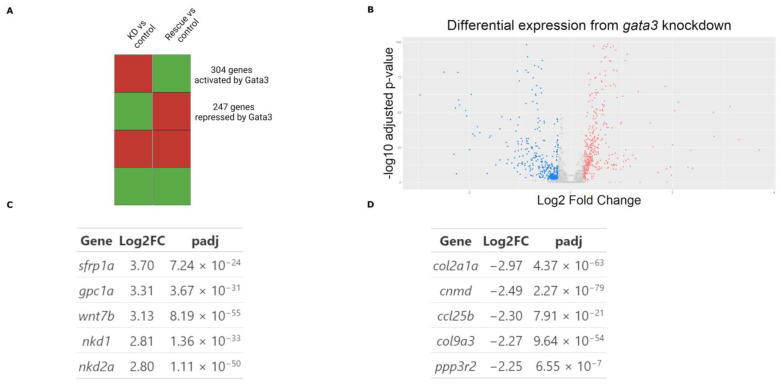
Changes in gata3 expression drive differential regulation. (A) A subset of differentially expressed genes which had directionally discordant changes between the knockdown and rescue groups (relative to the control) were selected for further bioinformatic analysis. (B) There were 551 differentially regulated genes selected for analysis. (C) The five most upregulated genes in the knockdown group. (D) The five most down regulated genes in the knockdown group.
Acknowledgments
This image is the copyrighted work of the attributed author or publisher, and
ZFIN has permission only to display this image to its users.
Additional permissions should be obtained from the applicable author or publisher of the image.
Full text @ Int. J. Mol. Sci.