
FIGURE
Figure 6
- ID
- ZDB-FIG-230124-136
- Publication
- Kar et al., 2023 - Predicting Modifiers of Genotype-Phenotype Correlations in Craniofacial Development
- Other Figures
- All Figure Page
- Back to All Figure Page
Figure 6
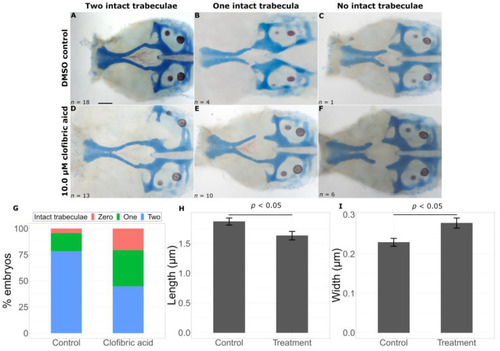
Clofibric acid worsens the gata3 mutant phenotype. Representative flat mounts show defects in the trabeculae with DMSO treatment ( |
Expression Data
Expression Detail
Antibody Labeling
Phenotype Data
Phenotype Detail
Acknowledgments
This image is the copyrighted work of the attributed author or publisher, and
ZFIN has permission only to display this image to its users.
Additional permissions should be obtained from the applicable author or publisher of the image.
Full text @ Int. J. Mol. Sci.