- Title
-
Zebrafish anterior segment mesenchyme progenitors are defined by function of tfap2a but not sox10
- Authors
- Vöcking, O., Van Der Meulen, K., Patel, M.K., Famulski, J.K.
- Source
- Full text @ Differentiation
|
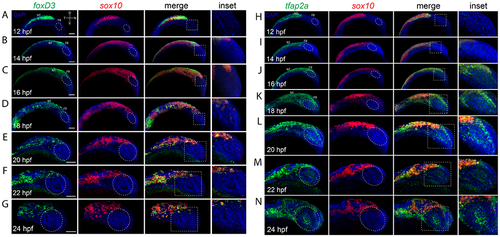
Co-expression analysis of cNCC markers during eye field and retinal morphogenesis. A-G) Two color FWISH analysis of foxD3 (green) and sox10 (red) at 12-24hpf with samples taken at 2h intervals. DNA was stained with DAPI (blue). Lateral images of volume projections of 3D confocal stacks from representative embryos are displayed. Strong co-expression of foxD3 and sox10 can be observed in the region of the notochord at early timepoints and throughout the neural crest stream starting at 16hpf. Periocular co-expression (white oval) is observed starting at 22hpf. H-N) Two color FWISH analysis of tfap2a (green) and sox10 (red) at 12-24hpf with samples taken at 2h intervals. DNA was stained with DAPI (blue). Lateral images of volume projections of 3D confocal stacks from representative embryos are displayed. Strong co-expression of tfap2a and sox10 can be observed in the region of the notochord as early as 12hpf and throughout the time course observed. Starting at 16hpf, tfap2a positive cells (yellow *) can be observed in the anterior segment (white oval). Scale bar = 100μm. NT = neural tube, FB = forebrain |
|
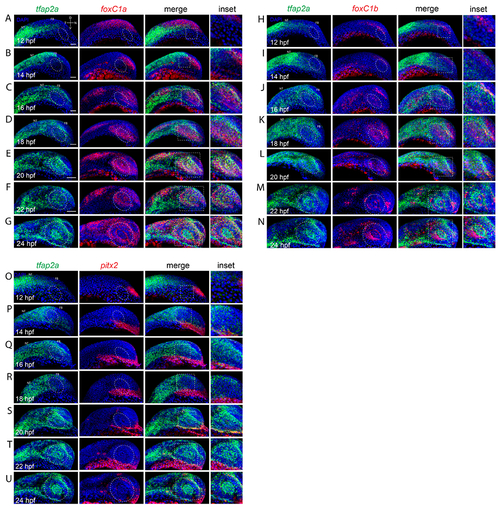
Co-expression analysis of tfap2a and anterior segment mesenchyme markers during eye field and retinal morphogenesis. A-G) Two color FWISH analysis of tfap2a (green) and foxC1a (red) at 12-24hpf with samples taken at 2h intervals. DNA was stained with DAPI (blue). Lateral images of volume projections of 3D confocal stacks from representative embryos are displayed. Co-expression of tfap2a and foxC1a first observed in the notochord and periocular regions at 16hpf. Starting at 18hpf, and extending to 24hpf, tfap2a/foxC1a double positive cells are detected in the anterior segment region (white oval). H-N) Two color FWISH analysis of tfap2a (green) and foxC1b (red) at 12-24hpf with samples taken at 2h intervals. DNA was stained with DAPI (blue). Lateral images of volume projections of 3D confocal stacks from representative embryos are displayed. Co-expression of tfap2a and foxC1b is first observed in the dorsal periocular regions (white oval) at 16hpf. Starting at 18hpf, and extending to 24hpf, tfap2a/foxC1b double positive cells are detected in the anterior segment region (white oval). O-U) Two color FWISH analysis of tfap2a (green) and pitx2 (red) at 12-24hpf with samples taken at 2h intervals. DNA was stained with DAPI (blue). Lateral images of volume projections of 3D confocal stacks from representative embryos are displayed. Co-expression of tfap2a and pitx2 is first observed in the ventral periocular regions at 20hpf. Co-expression of tfap2a and pitx2 in the anterior segment (white oval) is observed starting at 24hpf in the very dorsal and ventral regions. Scale bar = 100μm. NT = neural tube, FB = forebrain. |
|
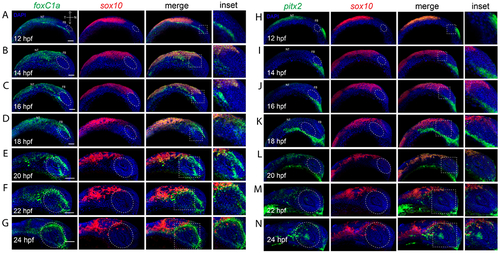
Co-expression analysis of sox10 and anterior segment mesenchyme markers during eye field and retinal morphogenesis. A-G) Two color FWISH analysis of foxC1a (green) and sox10 (red) at 12-24hpf with samples taken at 2h intervals. DNA was stained with DAPI (blue). Lateral images of volume projections of 3D confocal stacks from representative embryos are displayed. Strong co-expression between sox10 and foxC1a is observed starting at 14hpf in the notochord. Anterior segment (white oval) expression for foxC1a is detected starting at 18hpf and continuing up to 24hpf while sox10 expression is excluded from the anterior segment region in all timepoints. H-N) Two color FWISH analysis of pitx2 (green) and sox10 (red) at 12-24hpf with samples taken at 2h intervals. DNA was stained with DAPI (blue). Lateral images of volume projections of 3D confocal stacks from representative embryos are displayed. Co-expression between sox10 and pitx2 is first observed starting at 20hpf in the notochord but overall co-expression is minor. Pitx2 expression is primarily constrained to regions ventral of the developing eye. By 22-24hpf pitx2 expression is detected in the anterior segment space (white oval) and includes several cells exhibiting co-expression with sox10. Scale bar = 100μm. NT = neural tube, FB = forebrain. |
|
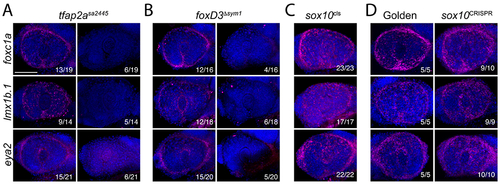
tfap2a and foxD3 are necessary for ASM specification. A) Fluorescent WISH analysis of foxC1a, lmx1b.1 and eya2 expression (magenta) in 32hpf embryos from tfap2asa2445/+ in-crosses. DNA was stained with DAPI (blue). Lateral images of volume projections of 3D confocal stacks from representative embryos are displayed. Proportion of embryos with corresponding expression phenotypes are displayed. In approximately 25% of embryos foxC1a, lmx1b.1 and eya2 expression was severely reduced. B) Fluorescent WISH analysis of foxC1a, lmx1b.1 and eya2 expression (magenta) in 32hpf embryos from foxD3sym1/+ in-crosses. DNA was stained with DAPI (blue). Lateral images of volume projections of 3D confocal stacks from representative embryos are displayed. Proportion of embryos with corresponding expression phenotypes are displayed. In approximately 25% of embryos foxC1a, lmx1b.1 and eya2 expression was severely reduced. C) Fluorescent WISH analysis of foxC1a, lmx1b.1 and eya2 expression (magenta) in 32hpf embryos from sox10cls/+ in-crosses. DNA was stained with DAPI (blue). Lateral images of volume projections of 3D confocal stacks from representative embryos are displayed. Proportion of embryos with corresponding expression phenotypes are displayed. All embryos examined displayed expected, wildtype, expression phenotypes. D) Fluorescent WISH analysis of foxC1a, lmx1b.1 and eya2 expression (magenta) in 32hpf embryos injected with golden crRNA or sox10 crRNA (CRISPR). DNA was stained with DAPI (blue). Lateral images of volume projections of 3D confocal stacks from representative embryos are displayed. Proportion of embryos with corresponding expression phenotypes are displayed. In both, golden and sox10 crRNA injected embryos expression of foxC1a, lmx1b.1 and eya2 was not affected. Scale bar = 100μm. |
|
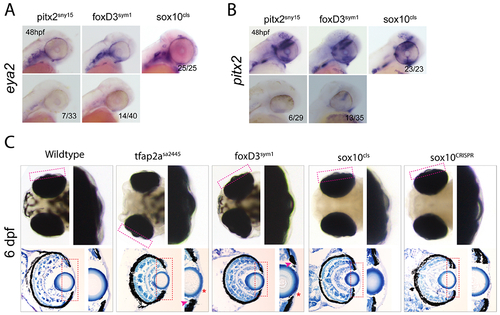
Anterior segment development does not require sox10 function. A) WISH detecting expression of eya2 in 48hpf embryos from in-crosses of pitx2sny15/+, foxD3sym1/+ or sox10cls/+. Proportion of embryos with corresponding expression phenotypes are displayed. Approximately 25% of embryos from pitx2sny15/+ or foxD3sym1/+ in-crosses display the absence of eya2 expression, while 100% of embryos from sox10cls/+ crosses show wildtype levels of expression at 48hpf. B) WISH detecting expression of pitx2 in 48hpf embryos from in-crosses of pitx2sny15/+, foxD3sym1/+ or sox10cls/+. Proportion of embryos with corresponding expression phenotypes are displayed. Approximately 25% of embryos from pitx2sny15/+ or foxD3sym1/+ in-crosses display the absence of pitx2 expression, while 100% of embryos from sox10cls/+ crosses show wildtype levels of expression at 48hpf. C) Whole mount dorsal images and cryosections of wildtype, tfap2asa2445/sa2445, foxD3sym1/sym1, sox10cls/cls or sox10CRISPR. Cranial structures, improperly set eyes, as well as the anterior segment (Magenta rectangle representing the enlargement) thickness and organization are malformed in tfap2asa2445/sa2445, foxD3sym1/sym1 larva but not in sox10cls/cls or sox10CRISPR. Toluidine blue staining of 6dpf old eyes reveals a thinned cornea (red *) and irregular shape of the ICA (magenta arrow) in tfap2asa2445/sa2445 and foxD3sym1/sym1 larvae, but not in sox10cls/cls or sox10CRISPR. |
|
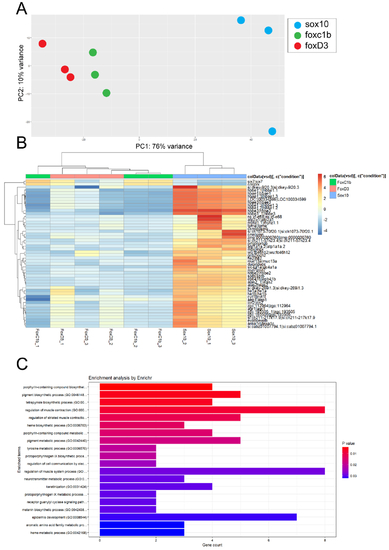
Transcriptomic comparison between sox10, foxD3 and foxC1b derived cNCCs. A) Principal component analysis comparing 48hpf Tg[sox70:GFP] (blue), Tg[foxD3:GFP] (red) and Tg[sox10:GFP] (green) isolated cNCC/POM transcriptomes. Each dot represents one biological replicate. Variance between the samples is least between foxD3 and foxC1b data sets which cluster together and far apart from sox10 samples. B) Cluster analysis of the biological replicates indicates a close relationship between foxD3 and foxC1b derived samples and a significant divergence from sox10 derived samples. Numerous genes are found to be differentially expressed between the foxD3/foxC1b and sox10 samples. C) Ontology enrichment analysis identifies sox10 datasets to exhibit an upregulation in pigmentation, muscle and hematopoietic biological pathways compared to ASM related processes such as keratinization. |

