
Fig. 2
- ID
- ZDB-FIG-240604-2
- Publication
- Vöcking et al., 2022 - Zebrafish anterior segment mesenchyme progenitors are defined by function of tfap2a but not sox10
- Other Figures
- All Figure Page
- Back to All Figure Page
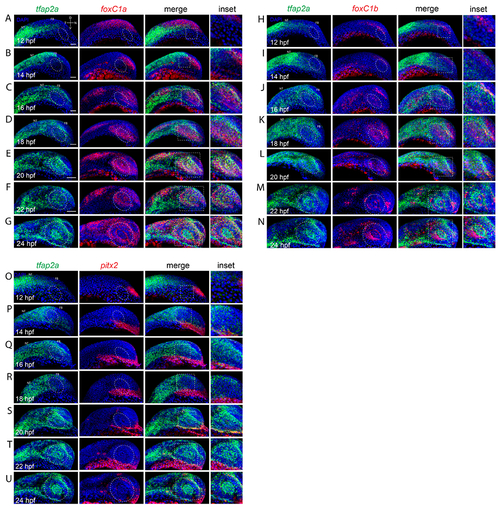
Co-expression analysis of tfap2a and anterior segment mesenchyme markers during eye field and retinal morphogenesis. A-G) Two color FWISH analysis of tfap2a (green) and foxC1a (red) at 12-24hpf with samples taken at 2h intervals. DNA was stained with DAPI (blue). Lateral images of volume projections of 3D confocal stacks from representative embryos are displayed. Co-expression of tfap2a and foxC1a first observed in the notochord and periocular regions at 16hpf. Starting at 18hpf, and extending to 24hpf, tfap2a/foxC1a double positive cells are detected in the anterior segment region (white oval). H-N) Two color FWISH analysis of tfap2a (green) and foxC1b (red) at 12-24hpf with samples taken at 2h intervals. DNA was stained with DAPI (blue). Lateral images of volume projections of 3D confocal stacks from representative embryos are displayed. Co-expression of tfap2a and foxC1b is first observed in the dorsal periocular regions (white oval) at 16hpf. Starting at 18hpf, and extending to 24hpf, tfap2a/foxC1b double positive cells are detected in the anterior segment region (white oval). O-U) Two color FWISH analysis of tfap2a (green) and pitx2 (red) at 12-24hpf with samples taken at 2h intervals. DNA was stained with DAPI (blue). Lateral images of volume projections of 3D confocal stacks from representative embryos are displayed. Co-expression of tfap2a and pitx2 is first observed in the ventral periocular regions at 20hpf. Co-expression of tfap2a and pitx2 in the anterior segment (white oval) is observed starting at 24hpf in the very dorsal and ventral regions. Scale bar = 100μm. NT = neural tube, FB = forebrain. |