
- Title
-
Brain endothelial cells acquire blood-brain barrier properties in the absence of Vegf-dependent CNS angiogenesis
- Authors
- Fetsko, A.R., Sebo, D.J., Taylor, M.R.
- Source
- Full text @ Dev. Biol.

Fig. 1. Zebrafish uw112 mutants express glut1b:mCherry in the absence of CNS angiogenesis. (A, B) Representative confocal microscopy images showing the glut1b:mCherry and plvap:EGFP labeled blood vessels in uw112 mutants in comparison to WT embryos and gpr124 mutants. Images are dorsal views of the head (anterior left) in live embryos at 2 and 3 dpf (A and B, respectively). At 2 dpf, uw112 and gpr124 mutants show a significant lack of central arteries (CtAs) as compared to WT (A). At 3 dpf, a distinct lack of blood vessels within the brain persists in both mutants (B). At both time points, uw112 mutants express glut1b:mCherry in the primordial hindbrain channels (PHBCs) (white arrows) while gpr124 mutants do not. Scale bars are 100 μm. (C) Quantification of the number of CtAs at 2 dpf (n = 3). (D) Quantification of the vasculature within the brain parenchyma at 3 dpf. For each group (n = 3), the blood vessels labeled with mCherry and those labeled with EGFP were quantified separately from the same fish. Data in both bar graphs (C, D) are presented as means ± standard error of the mean (SEM) (∗∗p < 0.01; ∗∗∗p < 0.001; ns = not significant). EXPRESSION / LABELING:
PHENOTYPE:
|

Fig. 2. Identification of zebrafish uw112 as a new mutant allele of kdrl. (A) Representative confocal images (dorsal views; anterior left) of the complementation test between uw112 and kdrlum19 mutants showing the same mutant phenotype as the uw112 mutants at 3 dpf. Scale bar is 100 μm. (B) DNA sequence for segments of kdrlWT and mutant kdrluw112 showing the T41A mutation (circled). The N-terminal protein sequence is also provided, showing the L14H protein mutation (highlighted). (C) SignalP-5.0 graphs predicting the presence of a signal peptide in the WT Kdrl protein verses the mutant Kdrl. PHENOTYPE:
|

Fig. 3. Vegfr tyrosine kinase inhibitors, DMH4 and AV-951, block CNS angiogenesis but not barriergenesis. (A) Representative confocal images (dorsal views; anterior left) of untreated, DMSO-treated, or inhibitor-treated glut1b:mCherry, plvap:EGFP embryos. Embryos were treated at 24 hpf then imaged at 54 hpf. Note that the inhibitor-treated embryos lack CtAs but express glut1b:mCherry in the PHBCs indicating that barriergenesis occurs in the absence of CNS angiogenesis. In addition, 1 μM DMH4 was as effective as 5 μM DMH4 at blocking CNS angiogenesis. AV-951 (1 μM) showed similar effects as 5 μM DMH4. Scale bars are 100 μm (top left) and 50 μm (top right). (B) Quantification of the number of CtAs at 2 dpf for untreated, DMSO-treated, or inhibitor-treated embryos (n = 3). (C) Quantification of the normalized RFI of glut1b:mCherry in untreated, DMSO-treated, or inhibitor-treated embryos at 2 dpf (n = 3). Data for (B) and (C) are presented as means ± SEM (∗∗∗p < 0.001; ns = not significant). |
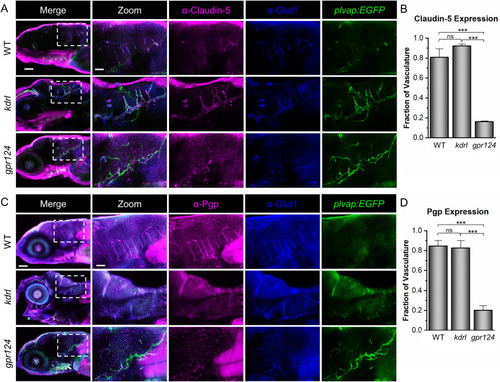
Fig. 4. Zebrafish kdrl, but not gpr124, mutants, express BBB markers. (A) Representative confocal microscopy images showing Claudin-5 staining. WT, kdrl, and gpr124 larvae were stained with ⍺-Claudin-5 and ⍺-Glut1. The plvap:EGFP transgene was used as a blood vessel marker. (B) Quantification was calculated from the fraction of the total blood vessels in the hindbrain labeled with ⍺-Claudin-5. (C, D) Representative confocal images of ⍺-Pgp staining at 5 dpf with the same controls as in (A) and quantification strategy as in (B). All images are lateral views (anterior left; dorsal top) of whole-mount stained larvae at 5 dpf. Scale bars are 100 μm for the merged images (left panels) and 40 μm for the zoomed images. Data in B and D are presented as means (n = 3) ± SEM (∗∗∗p < 0.001; ns = not significant). |
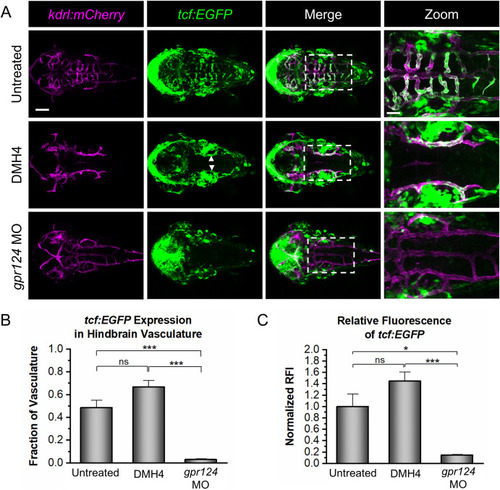
Fig. 5. Vegf signaling is not required for Wnt/β-catenin transcriptional activity. (A) Representative confocal images of tcf:EGFP, kdrl:mCherry embryos at 2 dpf that were untreated, DMH4-treated (DMH4), or injected with a gpr124 morpholino (gpr124 MO). tcf:EGFP signal is present in the WT brain vasculature (top panels) and in the PHBCs of the DMH4-treated embryos (middle panels; white arrows), but not the gpr124 MO-injected embryos (bottom panels). Scale bar is 100 μm for the first three columns and 40 μm for the zoomed images (right panels). (B) Quantification of the fraction of kdrl:mCherry-labeled hindbrain vasculature expressing tcf:EGFP. (C) Quantification of the normalized relative fluorescence intensity (RFI) of tcf:EGFP in the hindbrain vasculature. Data in B and C are presented as means (n = 4) ± SEM (∗p < 0.05; ∗∗∗p < 0.001; ns = not significant). |
Reprinted from Developmental Biology, 494, Fetsko, A.R., Sebo, D.J., Taylor, M.R., Brain endothelial cells acquire blood-brain barrier properties in the absence of Vegf-dependent CNS angiogenesis, 46-59, Copyright (2022) with permission from Elsevier. Full text @ Dev. Biol.