
- Title
-
Glomerular Endothelial Cell-Derived miR-200c Impairs Glomerular Homeostasis by Targeting Podocyte VEGF-A
- Authors
- Ursu, R., Sopel, N., Ohs, A., Tati, R., Buvall, L., Nyström, J., Schiffer, M., Müller-Deile, J.
- Source
- Full text @ Int. J. Mol. Sci.
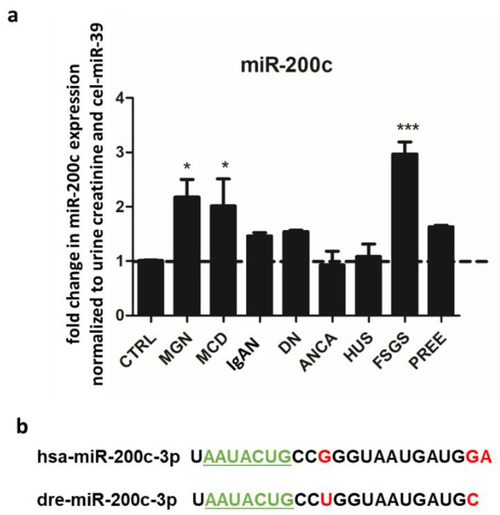
miR-200c is upregulated in urine from patients with MGN, MCD and FSGS. ( |
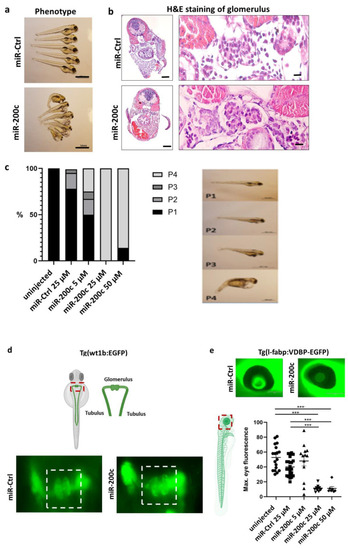
miR-200c mimic induces edema, proteinuria, podocyte effacement and loss of endothelial fenestrations. Zebrafish were injected with an miR-Ctrl mimic and miR-200c-3p mimic at the one-to-four cell stage. ( |
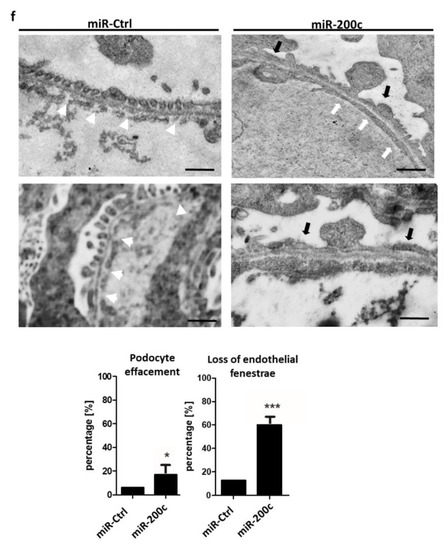
miR-200c mimic induces edema, proteinuria, podocyte effacement and loss of endothelial fenestrations. Zebrafish were injected with an miR-Ctrl mimic and miR-200c-3p mimic at the one-to-four cell stage. ( |
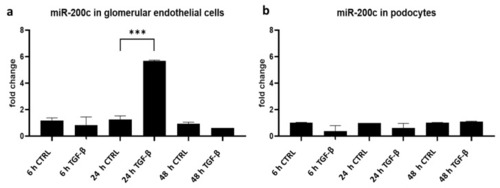
TGF-β stimulation induces miR-200c expression in cultured glomerular endothelial cells. ( |

miR-200c overexpression alters the expression of ZEB1/2 and VEGF-A. ( |
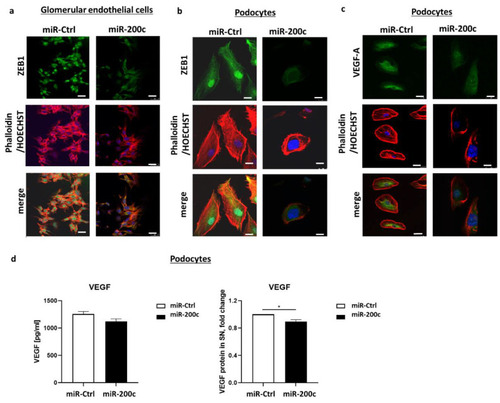
miR-200c overexpression decreases VEGF-A and ZEB1 on protein level. Images show immunofluorescent staining with phalloidin (red), anti-ZEB1 (green in ( |