
IMAGE
Figure 5
- ID
- ZDB-IMAGE-221214-223
- Publication
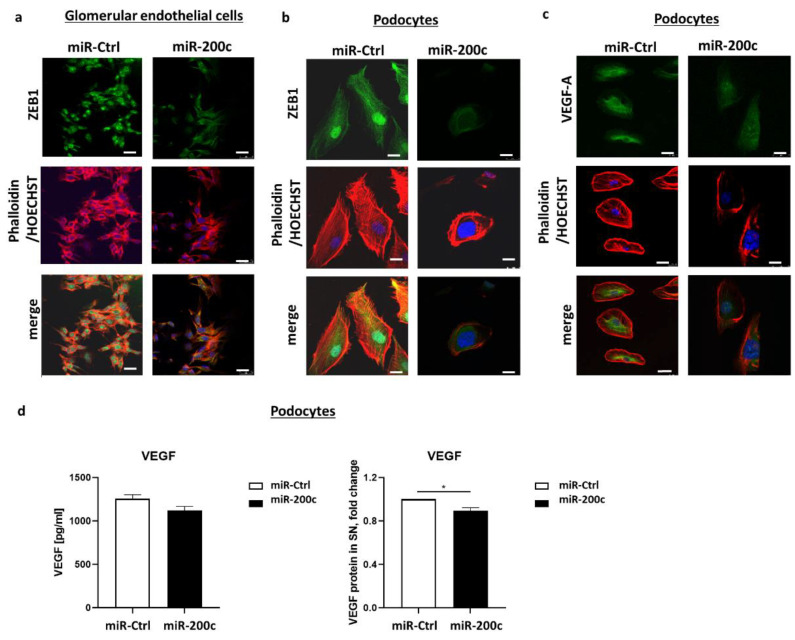
- Ursu et al., 2022 - Glomerular Endothelial Cell-Derived miR-200c Impairs Glomerular Homeostasis by Targeting Podocyte VEGF-A
- All Figures
- Figures for Ursu et al., 2022
Image
|
Figure Caption
Figure 5
miR-200c overexpression decreases VEGF-A and ZEB1 on protein level. Images show immunofluorescent staining with phalloidin (red), anti-ZEB1 (green in (
Acknowledgments
This image is the copyrighted work of the attributed author or publisher, and
ZFIN has permission only to display this image to its users.
Additional permissions should be obtained from the applicable author or publisher of the image.
Full text @ Int. J. Mol. Sci.