
- Title
-
Comprehensive maturity of nuclear pore complexes regulates zygotic genome activation
- Authors
- Shen, W., Gong, B., Xing, C., Zhang, L., Sun, J., Chen, Y., Yang, C., Yan, L., Chen, L., Yao, L., Li, G., Deng, H., Wu, X., Meng, A.
- Source
- Full text @ Cell

Figure 1. Nuclear protein profiling in zebrafish early embryos by quantitative proteomics (A) Workflow of mass spectrometry for isolated nuclei and whole cells. See also STAR Methods. (B) Examples of isolated nuclei stained with WGA (NPCs) and DAPI (DNA). BF, bright field. (C) Correlation analysis of 512c/32c protein abundance ratios based on Pearson method. A/B and a/b were two biological replicates of 512c and 32c, respectively. (D) Volcano plots of 512c/32c abundance ratio from nuclei (left) or whole-cell proteomic data (right). Differential expression was defined by fold change (512c/32c) >2 or <0.5 and q value < 0.05 (n = 2 replicates). (E and F) Bar plot (top) of 512c/32c abundance ratios and heatmap of relative abundance (lower) of some maternal TFs (E) or NPC components (F). Top, data were shown as mean ± SD from pairwise comparison of 2 replicates in 512c and 32c embryos. Each circle indicated one comparison. See also Table S1 |

Figure 2. Dynamic nuclear transport of nuclear proteins in zebrafish early embryos (A–C) Nuclear accumulation of endogenous maternal TFs Eomesa (A), Nanog (B), and pSmad1/5/9 (C) in embryos at indicated stages (or time postfertilization). Left panel, representative images in the nucleus (DAPI-positive) in embryos at indicated stages. Right panel, quantified signal intensity in the nucleus (N) and cytoplasm (C) and N/C ratio. Ne, embryo number; Nc, cell number. The data were shown as mean ± SEM (A) or mean ± SD (B and C, also for other data unless otherwise stated). a.u., arbitrary units. (D–F) Dynamic nuclear transport of microinjected proteins. Purified proteins expressed in E. coli were indicated by yellow arrows (D). 1c-stage Tg(ef1α:sNLS-GFP) embryos were injected with 2 ng of indicated protein (E) or indicated dosage of sNM (F). TgsNG, Tg(ef1α:sNLS-GFP). Injected proteins: GMsN, GST-mCherry-sNLS; GM: GST-mCherry; sNM, sNLS-mCherry; M, mCherry. (G and H) Nuclear transport dynamics of sNLS-mCherry protein beyond MBT stages. 2 ng sNLS-mCherry protein was microinjected at one-cell stage. (H) Significant differences were considered as follows: ns, nonsignificance, p ≥ 0.05; ∗, p < 0.05; ∗∗, p < 0.01; ∗∗∗, p < 0.001. (I–K) In vitro nuclear transport assay results. (I) Schematic illustration of the assay. See also STAR Methods. (J) Representative images of GST-mCherry-sNLS protein (GMsN, import cargo) and 70-kDa FITC-labeled dextran (FD-70, negative control) in the nucleus as well as WGA-stained Nups on NE. (K) Significant differences were considered as follows: ns, nonsignificance, p ≥ 0.05; ∗, p < 0.05; ∗∗, p < 0.01; ∗∗∗, p < 0.001. See also Figures S1 andS2 and Videos S1 |

Figure 3. Gradual recruitment of NPC components during early embryogenesis (A) Detection of specific Nups in the nuclear rim in early embryos. DAPI or SYTOX, nuclei. The fraction of nuclei with the representative pattern was indicated at the bottom. Intranuclear signals could be residual NE embedded with NPCs. (B) NE/NPCs localization of transgenic Nup133-GFP and GFP-Nup37 proteins at indicated cell-cycle phases and stages. 100 pg/embryo of WGA-Alex647 was injected at 1c. (C and D) STED microscopy of individual NPCs with WGA-Alexa647 staining. Relative intensity was NPC intensity minus background intensity (same applied to following figures). HD, hardly detected. N/C ratio of sNM was recapitulated from Figure 2H. (E–H) Co-detection of Nup153 (E) or Nup358 (G) with WGA by STED microscopy. The boxed areas in the 3rd row were enlarged in the 4th row by color matching. The ratio of nuclei with representative NPC pattern was indicated in the top row. HD, hardly detected. Nnpc, NPC number. See also Figure S3 and Video S4. |
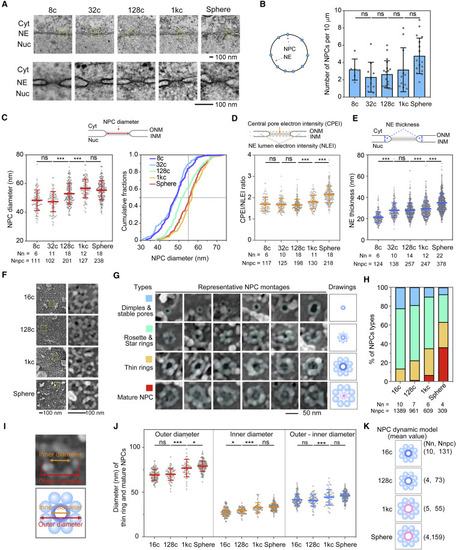
Figure 4. Progressive structural maturity of NPCs during early embryonic development (A) Representative NPCs in embryos observed by TEM. NE, nuclear envelope; Nuc, nucleus; Cyt, cytoplasm. The measurements in (B)–(E) were based on TEM images. (B) Change of NPC density. Significant differences were considered as follows: ns, nonsignificance, p ≥ 0.05; ∗, p < 0.05; ∗∗, p < 0.01; ∗∗∗, p < 0.001. (C) Change of NPC diameter. Top, illustration of diameter measurement. ONM, outer nuclear membrane; INM, inner nuclear membrane; Nn, nuclei number; Nnpc, NPC number. Significant differences were considered as follows: ns, nonsignificance, p ≥ 0.05; ∗, p < 0.05; ∗∗, p < 0.01; ∗∗∗, p < 0.001. (D and E) Changes of the relative electron intensity of NPC central pore (D) and the thickness of NE (E). Significant differences were considered as follows: ns, nonsignificance, p ≥ 0.05; ∗, p < 0.05; ∗∗, p < 0.01; ∗∗∗, p < 0.001. (F) Representative FESEM images of nuclear surface with NPCs embedded. (G) Montages of representative types of NPCs obtained by FESEM. NPCs were masked by transparent cyan. (H) The ratios of different types of NPCs at different developmental stages. Different types were indicated by different colors as shown in (G). (I) Illustration of diameters of FESEM-observed NPCs. (J) Change of NPC diameters at different stages. Only thin rings and mature NPCs were calculated. Significant differences were considered as follows: ns, nonsignificance, p ≥ 0.05; ∗, p < 0.05; ∗∗, p < 0.01; ∗∗∗, p < 0.001. (K) Illustration of NPCs states during early embryogenesis according to data in (J). |
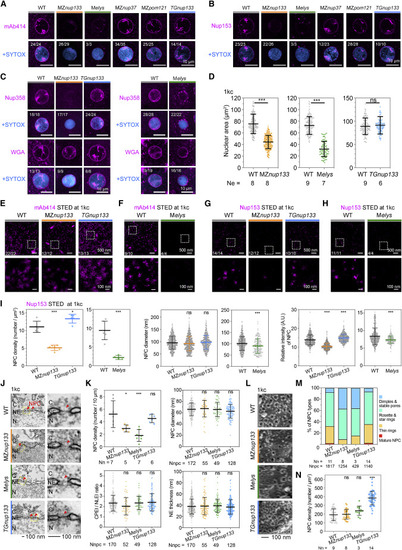
Figure 5. Impact of nup133 or elys mutation and nup133 overexpression on NPC assembly (A–C) Representative immunofluorescence images of NPC signals in nuclei detected by specific antibodies or WGA at 1kc stage. TGnup133, Tg(ef1α:nup133-GFP). The fraction of nuclei with representative signal pattern was indicated. (D) Average nuclear area in embryos of different backgrounds at 1kc stage. Ne, embryo number. Significant differences were considered as follows: ns, nonsignificance, p ≥ 0.05; ∗, p < 0.05; ∗∗, p < 0.01; ∗∗∗, p < 0.001. (E–H) STED microscopic images of individual NPCs labeled with mAb414 or Nup153 at 1kc stage. (I) Nup153-labeled NPC parameters based on STED images at 1kc stage in (G) and (H). Significant differences were considered as follows: ns, nonsignificance, p ≥ 0.05; ∗, p < 0.05; ∗∗, p < 0.01; ∗∗∗, p < 0.001. (J and K) TEM-detected NPCs in nuclei of embryos at 1kc. Representative images of NPCs (indicated by red arrowheads) were shown in (J). NE, nuclear envelope; N, nucleus; C, cytoplasm; Nn, nuclei number; Nnpc, NPC number. (K) Significant differences were considered as follows: ns, nonsignificance, p ≥ 0.05; ∗, p < 0.05; ∗∗, p < 0.01; ∗∗∗, p < 0.001. (L–N) Representative FESEM images of isolated nuclear surface embedded with NPCs (L), ratio of NPC types (M), and NPC density (N) in different types of embryos at 1kc stage. Each dot in (N) represented one measurement in a region of interest (ROI). (N) Significant differences were considered as follows: ns, nonsignificance, p ≥ 0.05; ∗, p < 0.05; ∗∗, p < 0.01; ∗∗∗, p < 0.001. See also Figure S4. |
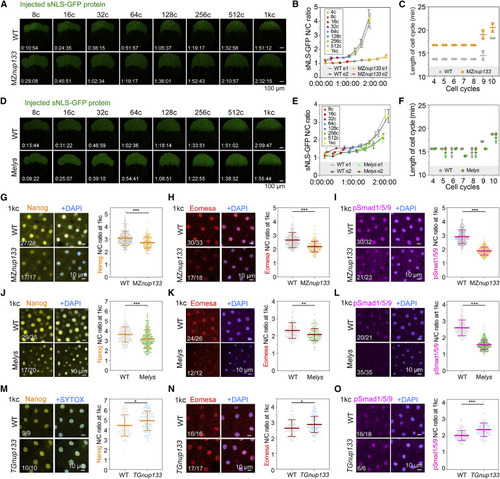
Figure 6. Impact of nup133 or elys mutation and nup133 overexpression on nuclear transport of TFs (A–F) Nuclear transport dynamics of microinjected sNLS-GFP protein in MZnup133 (A–C) or Melys (D–F) mutants. 2 ng/embryo sNLS-GFP protein was microinjected at 1c for analysis. The relative time was referred to the start of live-cell imaging. (G–O) Nuclear accumulation of Nanog (G, J, and M), Eomesa (H, K, and N) and pSmad1/5/9 (I, L, and O) and their N/C ratios in 1kc-stage embryos of different genetic backgrounds. Significant differences were considered as follows: ns, nonsignificance, p ≥ 0.05; ∗, p < 0.05; ∗∗, p < 0.01; ∗∗∗, p < 0.001. See also Figure S4 and Videos S5 and S6. |

Figure 7. Impact of nup133 or elys mutation and nup133 overexpression on ZGA (A–F) Transcriptome comparison between MZnup133 (A–C) or Melys (D–F) mutant and WT embryo at different stages. Top panel, composition of differentially expressed genes (DEGs) with fold change >2 or <0.5 and q value < 0.05. Gene classes60: ZGe, early zygotic genes; ZGl, late zygotic genes; MGe, early degraded maternal genes; MGl, late degraded maternal genes; SS1, semi-stable I genes; SS2, semi-stable II genes. Bottom panel, zygotic gene classes: ZGpm, pre-MBT zygotic-only genes18,23; ZG1w, first-wave zygotic-only genes18; ZGnps, zygotic genes strongly downregulated in MZnanog;MZpou5f3;MZsox19b triple mutants (MZnps) at 4 hpf.26 The number of zygotic genes within a class was listed in parenthesis. (G) Venn diagram showing proportions of downregulated genes shared between different types of mutants. (H) The model of clock-like comprehensive NPCs maturity for ZGA timing control. The time point for minor or major ZGA was indicated by a vertical gray or black dotted line, respectively. NPCs in 1c-stage embryo were colored in gray without experimental examination. ND, not determinable due to asynchronous cell divisions. See also Figures S5 and S6 and Table S2. |
Reprinted from Cell, 185(26), Shen, W., Gong, B., Xing, C., Zhang, L., Sun, J., Chen, Y., Yang, C., Yan, L., Chen, L., Yao, L., Li, G., Deng, H., Wu, X., Meng, A., Comprehensive maturity of nuclear pore complexes regulates zygotic genome activation, 4954-4970.e20, Copyright (2022) with permission from Elsevier. Full text @ Cell