
Fig. 2
- ID
- ZDB-IMAGE-230525-9
- Publication
- Shen et al., 2022 - Comprehensive maturity of nuclear pore complexes regulates zygotic genome activation
- All Figures
- Figures for Shen et al., 2022
|
Fig. 2
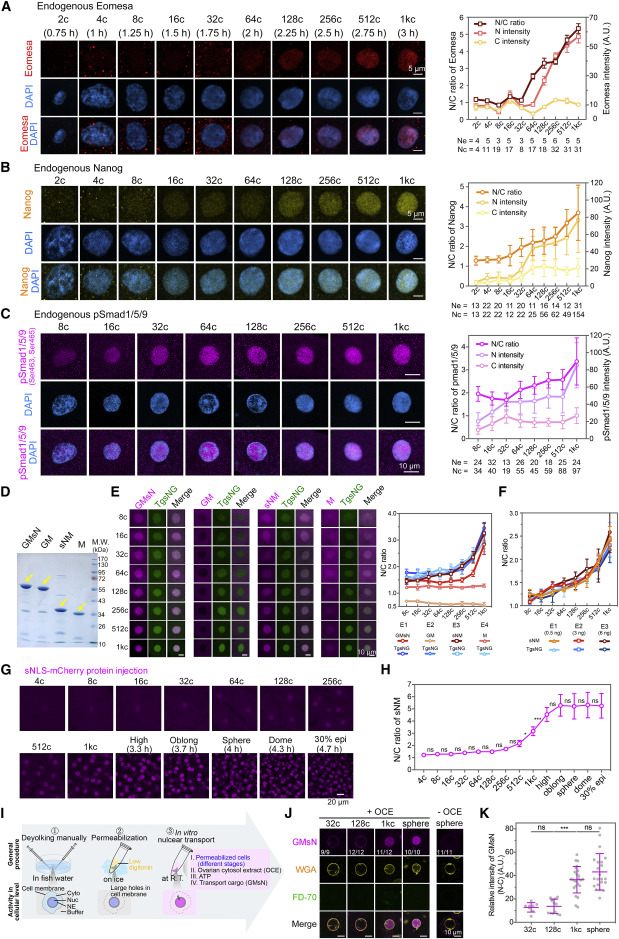
Figure 2. Dynamic nuclear transport of nuclear proteins in zebrafish early embryos (A–C) Nuclear accumulation of endogenous maternal TFs Eomesa (A), Nanog (B), and pSmad1/5/9 (C) in embryos at indicated stages (or time postfertilization). Left panel, representative images in the nucleus (DAPI-positive) in embryos at indicated stages. Right panel, quantified signal intensity in the nucleus (N) and cytoplasm (C) and N/C ratio. Ne, embryo number; Nc, cell number. The data were shown as mean ± SEM (A) or mean ± SD (B and C, also for other data unless otherwise stated). a.u., arbitrary units. (D–F) Dynamic nuclear transport of microinjected proteins. Purified proteins expressed in E. coli were indicated by yellow arrows (D). 1c-stage Tg(ef1α:sNLS-GFP) embryos were injected with 2 ng of indicated protein (E) or indicated dosage of sNM (F). TgsNG, Tg(ef1α:sNLS-GFP). Injected proteins: GMsN, GST-mCherry-sNLS; GM: GST-mCherry; sNM, sNLS-mCherry; M, mCherry. (G and H) Nuclear transport dynamics of sNLS-mCherry protein beyond MBT stages. 2 ng sNLS-mCherry protein was microinjected at one-cell stage. (H) Significant differences were considered as follows: ns, nonsignificance, p ≥ 0.05; ∗, p < 0.05; ∗∗, p < 0.01; ∗∗∗, p < 0.001. (I–K) In vitro nuclear transport assay results. (I) Schematic illustration of the assay. See also STAR Methods. (J) Representative images of GST-mCherry-sNLS protein (GMsN, import cargo) and 70-kDa FITC-labeled dextran (FD-70, negative control) in the nucleus as well as WGA-stained Nups on NE. (K) Significant differences were considered as follows: ns, nonsignificance, p ≥ 0.05; ∗, p < 0.05; ∗∗, p < 0.01; ∗∗∗, p < 0.001. See also Figures S1 andS2 and Videos S1
Reprinted from Cell, 185(26), Shen, W., Gong, B., Xing, C., Zhang, L., Sun, J., Chen, Y., Yang, C., Yan, L., Chen, L., Yao, L., Li, G., Deng, H., Wu, X., Meng, A., Comprehensive maturity of nuclear pore complexes regulates zygotic genome activation, 4954-4970.e20, Copyright (2022) with permission from Elsevier. Full text @ Cell