FIGURE SUMMARY
Title

In situ assessment of statins' effect on autophagic activity in zebrafish larvae cardiomyocytes

Authors
Zhang, J., Zuo, Z., Li, J., Wang, Y., Huang, J., Xu, L., Jin, K., Lu, H., Dai, Y.
Source
Full text @ Front Cardiovasc Med

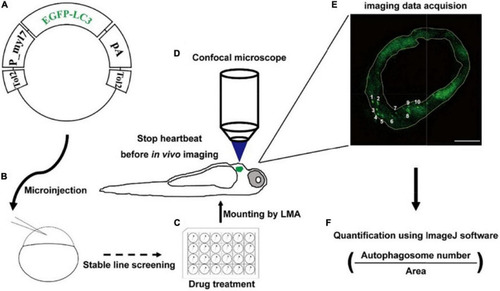
Strategy of monitoring autophagic activity in zebrafish cardiomyocytes in situ. (A) The structure of transgenic plasmid for labeling autophagosomes. (B) Microinjection of the transgenic mixture into one-cell staged embryos for generating stable lines. (C) Drug treatment of zebrafish larvae using cell culture plates. (D) Transgenic larvae are mounted, stopped heartbeat, and then imaged under a confocal microscope. (E) Confocal image shows the EGFP-positive puncta that are characterized as autophagosomes. The area of heart tissue is selected by a yellow polygon using the ImageJ software. Arabic numerals show autophagosomes. Scale bar: 20 μm. (F) The density is calculated by dividing the number of autophagosomes by the area of heart tissue.

The density of autophagosomes in zebrafish heart is regulated by known autophagy-modulating drugs. (A) Representative images of 3-dpf zebrafish heart of Tg(myl7:EGFP-LC3) line when treating with indicated drugs for 24 h. The top row shows the Z-stack maximum projections (scale bar: 50 μm), the bottom row shows the single slice (scale bar: 10 μm), inset in the bottom row shows the single punctum in indicated treated groups (scale bar: 3 μm). Arrowhead represents the autophagosome, double arrow line represents the diameter of the autophagosome. (B) Quantification of the density of autophagosomes in 3-dpf zebrafish heart of Tg(myl7:EGFP-LC3) line when treating with indicated drugs for 24 h. The data are shown as mean ± s.e.m for each group. n = 18 in control group, n = 55 in 3MA group, n = 58 in BafA group, n = 65 in P/E group, and n = 36 in Rapamycin group. (C) Quantification of the diameter of puncta in 3-dpf zebrafish heart when treated with BafA compared with the control group. n = 50 in the control group, and n = 50 in the BafA group. ***p < 0.001. A, atrium; V, ventricle.

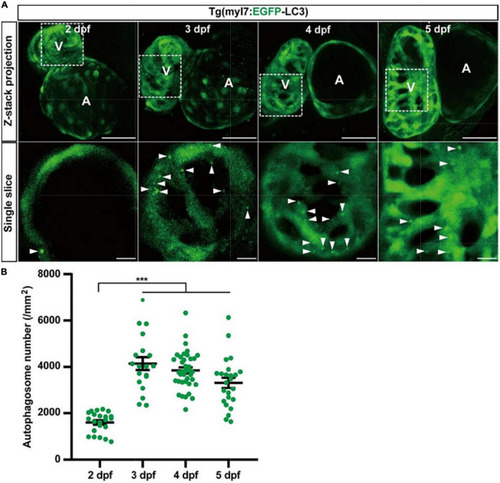
The density of autophagosomes in zebrafish cardiomyocytes is quantified during 2–5 dpf. (A) Representative images of zebrafish heart of Tg(myl7:EGFP-LC3) line at indicated developmental stages. Top row shows the Z-stack maximum projections (scale bar: 50 μm), and the bottom row shows the single slice (scale bar: 10 μm). Arrowhead represents the autophagosome. (B) Quantification of the density of autophagosomes in zebrafish cardiomyocytes of indicated developmental stages. The data are shown as mean ± s.e.m for each group. n = 22 at 2 dpf, n = 19 at 3 dpf, n = 38 at 4 dpf, and n = 24 at 5 dpf. ***p < 0.001. A, atrium; V, ventricle.

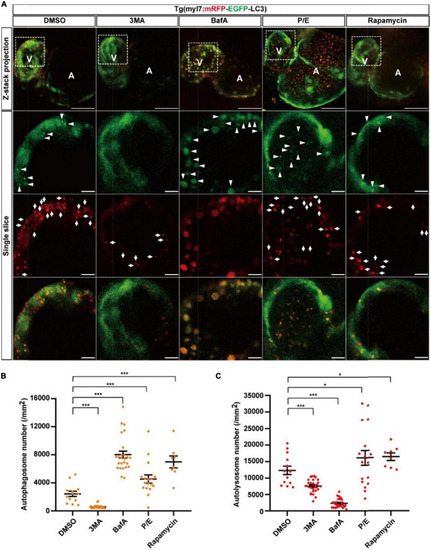
The densities of autophagosomes and autolysosomes in zebrafish cardiomyocytes are regulated by known autophagy-modulating drugs. (A) Representative images of 3-dpf zebrafish heart of Tg(myl7:mRFP-EGFP-LC3) line when treated with indicated drugs for 24 h. The top row shows the Z-stack maximum projections with merged EGFP and mRFP signals (scale bar: 50 μm), the second row shows the single slice with EGFP signal, the third row shows the single slice with mRFP signal, and the bottom row shows the single slice with merged EGFP and mRFP signals (scale bar: 10 μm). Arrowhead represents autophagosome, the arrow represents autolysosome. (B) Quantification of the density of autophagosomes in 3-dpf zebrafish heart of Tg(myl7:mRFP-EGFP-LC3) line when treated with indicated drugs for 24 h. (C) Quantification of the density of autolysosomes in 3-dpf zebrafish heart of Tg(myl7:mRFP-EGFP-LC3) line when treated with indicated drugs for 24 h. The data are shown as mean ± s.e.m for each group. n = 13 in control group, n = 26 in 3MA group, n = 25 in BafA group, n = 17 in P/E group, and n = 8 in Rapamycin group. *p < 0.05, ***p < 0.001. A, atrium; V, ventricle.

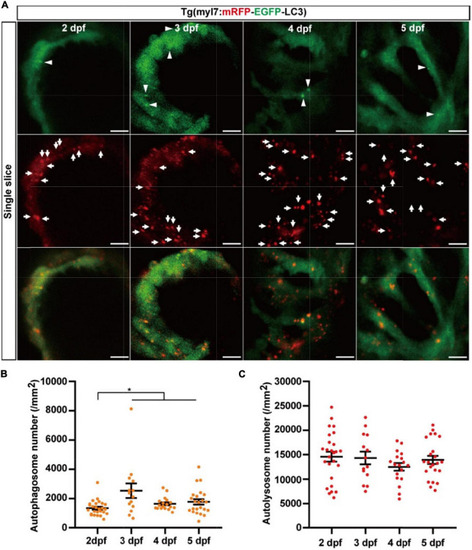
The densities of autophagosomes and autolysosomes in zebrafish hearts are quantified simultaneously during 2–5 dpf. (A) Representative images of 3-dpf zebrafish heart of Tg(myl7:mRFP-EGFP-LC3) line at indicated developmental stages. The top row shows the single slice with an EGFP signal, the second row shows the single slice with an mRFP signal, and the bottom row shows the single slice with merged EGFP and mRFP signals (scale bar: 10 μm). Arrowhead represents autophagosomes, the arrow represents autolysosomes. (B) Quantification of the density of autophagosomes in zebrafish heart of Tg(myl7:mRFP-EGFP-LC3) line at indicated developmental stages. (C) Quantification of the density of autolysosomes in zebrafish heart of Tg(myl7:mRFP-EGFP-LC3) line at indicated developmental stages. The data are shown as mean ± s.e.m for each group. n = 26 at 2 dpf, n = 14 at 3 dpf, n = 18 at 4 dpf, and n = 23 at 5 dpf. *p < 0.05. A, atrium; V, ventricle.

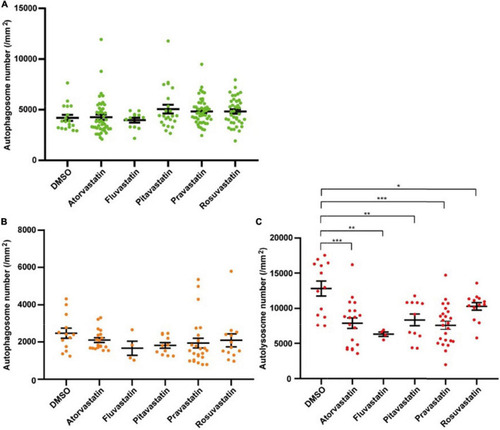
The densities of autophagosomes and autolysosomes in zebrafish cardiomyocytes are quantified when treated with statins. (A) Quantification of the density of autophagosomes in 3-dpf zebrafish heart of Tg(myl7:EGFP-LC3) line when treated with indicated statins. (B) Quantification of the densities of autophagosomes in 3-dpf zebrafish heart of Tg(myl7:mRFP-EGFP-LC3) line when treated with indicated statins. (C) Quantification of the densities of autolysosomes in 3-dpf zebrafish heart of Tg(myl7:mRFP-EGFP-LC3) line when treated with indicated statins. The data are shown as mean ± s.e.m for each group. n = 13 in the control group, n = 19 in the atorvastatin group, n = 4 in the fluvastatin group, n = 11 in pitavastatin, n = 24 in the pravastatin group, and n = 13 in the rosuvastatin group. *p < 0.05, **p < 0.01, ***p < 0.001.

Acknowledgments
This image is the copyrighted work of the attributed author or publisher, and ZFIN has permission only to display this image to its users. Additional permissions should be obtained from the applicable author or publisher of the image. Full text @ Front Cardiovasc Med