IMAGE

FIGURE 6

ID
ZDB-IMAGE-221211-86
Source
Figures for Zhang et al., 2022
Image
Figure Caption

FIGURE 6

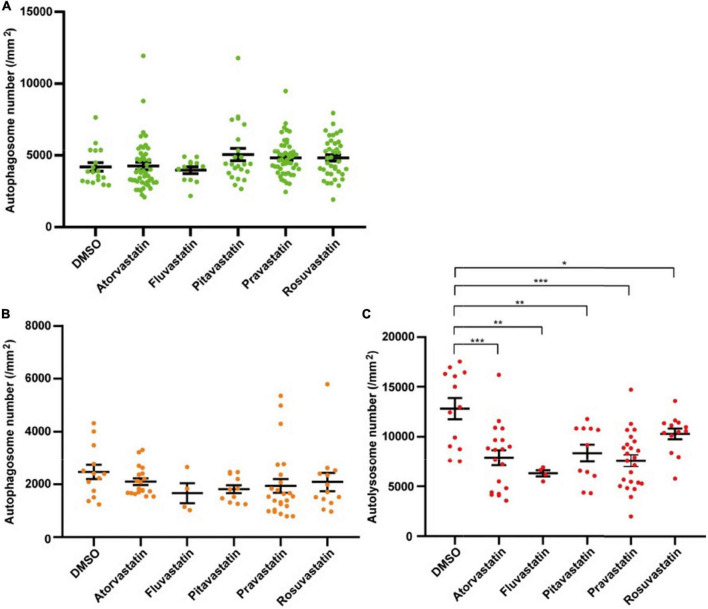
The densities of autophagosomes and autolysosomes in zebrafish cardiomyocytes are quantified when treated with statins. (A) Quantification of the density of autophagosomes in 3-dpf zebrafish heart of Tg(myl7:EGFP-LC3) line when treated with indicated statins. (B) Quantification of the densities of autophagosomes in 3-dpf zebrafish heart of Tg(myl7:mRFP-EGFP-LC3) line when treated with indicated statins. (C) Quantification of the densities of autolysosomes in 3-dpf zebrafish heart of Tg(myl7:mRFP-EGFP-LC3) line when treated with indicated statins. The data are shown as mean ± s.e.m for each group. n = 13 in the control group, n = 19 in the atorvastatin group, n = 4 in the fluvastatin group, n = 11 in pitavastatin, n = 24 in the pravastatin group, and n = 13 in the rosuvastatin group. *p < 0.05, **p < 0.01, ***p < 0.001.

Acknowledgments
This image is the copyrighted work of the attributed author or publisher, and ZFIN has permission only to display this image to its users. Additional permissions should be obtained from the applicable author or publisher of the image. Full text @ Front Cardiovasc Med