IMAGE

FIGURE 3

ID
ZDB-IMAGE-221211-82
Source
Figures for Zhang et al., 2022
Image
Figure Caption

FIGURE 3

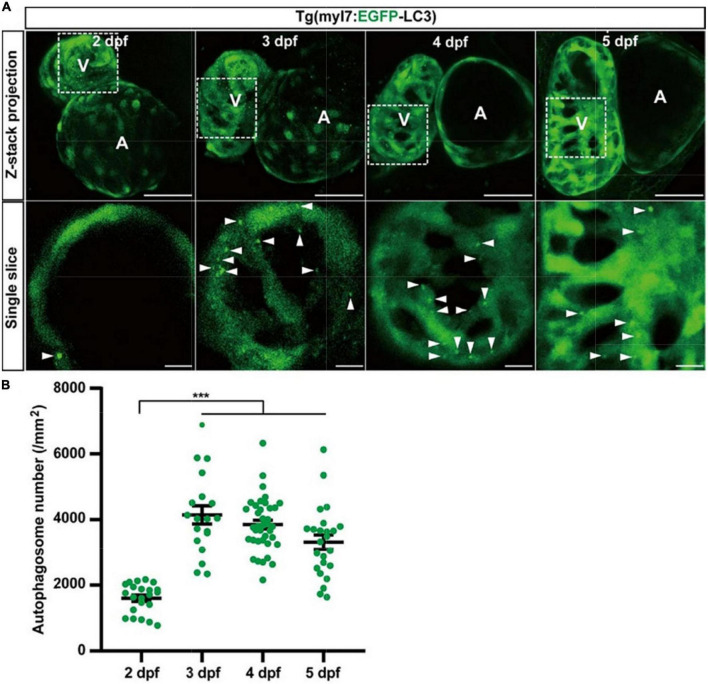
The density of autophagosomes in zebrafish cardiomyocytes is quantified during 2–5 dpf. (A) Representative images of zebrafish heart of Tg(myl7:EGFP-LC3) line at indicated developmental stages. Top row shows the Z-stack maximum projections (scale bar: 50 μm), and the bottom row shows the single slice (scale bar: 10 μm). Arrowhead represents the autophagosome. (B) Quantification of the density of autophagosomes in zebrafish cardiomyocytes of indicated developmental stages. The data are shown as mean ± s.e.m for each group. n = 22 at 2 dpf, n = 19 at 3 dpf, n = 38 at 4 dpf, and n = 24 at 5 dpf. ***p < 0.001. A, atrium; V, ventricle.

Acknowledgments
This image is the copyrighted work of the attributed author or publisher, and ZFIN has permission only to display this image to its users. Additional permissions should be obtained from the applicable author or publisher of the image. Full text @ Front Cardiovasc Med