IMAGE

FIGURE 1

ID
ZDB-IMAGE-221211-80
Source
Figures for Zhang et al., 2022
Image
Figure Caption

FIGURE 1

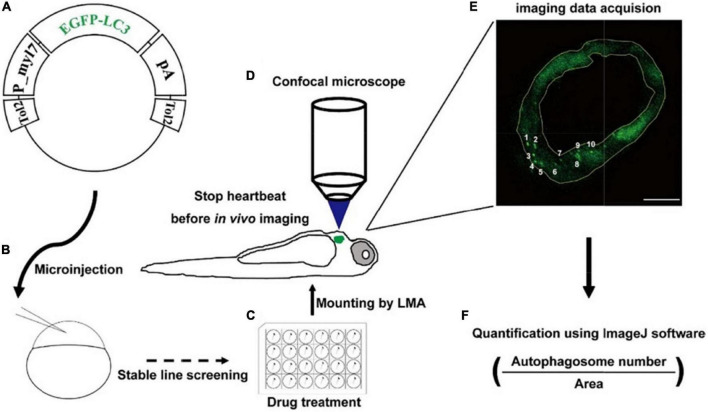
Strategy of monitoring autophagic activity in zebrafish cardiomyocytes in situ. (A) The structure of transgenic plasmid for labeling autophagosomes. (B) Microinjection of the transgenic mixture into one-cell staged embryos for generating stable lines. (C) Drug treatment of zebrafish larvae using cell culture plates. (D) Transgenic larvae are mounted, stopped heartbeat, and then imaged under a confocal microscope. (E) Confocal image shows the EGFP-positive puncta that are characterized as autophagosomes. The area of heart tissue is selected by a yellow polygon using the ImageJ software. Arabic numerals show autophagosomes. Scale bar: 20 μm. (F) The density is calculated by dividing the number of autophagosomes by the area of heart tissue.

Acknowledgments
This image is the copyrighted work of the attributed author or publisher, and ZFIN has permission only to display this image to its users. Additional permissions should be obtained from the applicable author or publisher of the image. Full text @ Front Cardiovasc Med