
- Title
-
Fmrp regulates neuronal balance in embryonic motor circuit formation
- Authors
- Barker, C.M., Miles, K.D., Doll, C.A.
- Source
- Full text @ Front. Neurosci.
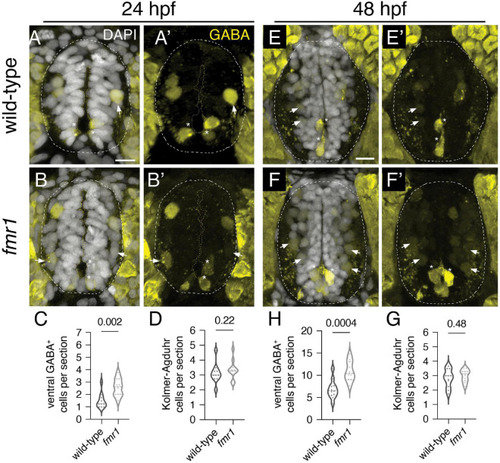
Fmrp restricts the production of GABAergic cells in the ventral spinal cord. Immunohistochemistry to detect gamma-aminobutyric acid (GABA) at 24 h post-fertilization [hpf; (A,B) and (A’,B’)] and 48 hpf (E,F) and (E’,F’) on transverse sections of trunk spinal cord reveals two populations of ventral GABA+ interneurons (INs): robustly GABA-expressing Kolmer–Agduhr (KA) INs (asterisks) that line the central canal (outlined in yellow dashed line) and a group of more weakly-expressing GABA+ INs positioned in the ventrolateral spinal cord (arrowheads). This GABA antibody produces a bright artifact outside of the spinal cord, and the cord is therefore outlined in a dashed oval in DAPI-merged images. Quantification of ventral GABA+ cells at 24 hpf [(C); two-tailed t-test] and 48 hpf [(G); two-tailed t-test], and KA neurons at 24 hpf [(D); Mann–Whitney test] and 48 hpf [(H); two-tailed t-test]. Quantification reflects the average number of cells per section, averaged by embryo. Scale bar = 10 μm. P-values indicated in graphs, where p < 0.05 is considered significant. |
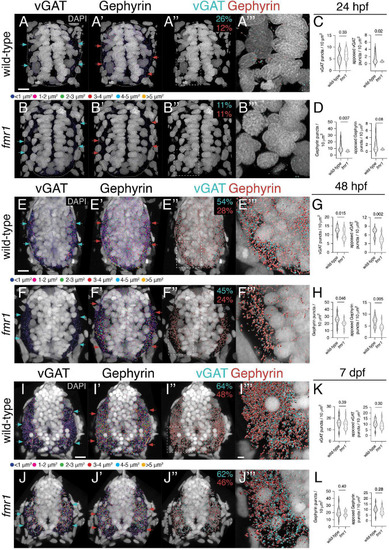
Fmrp developmentally regulates the expression of inhibitory synaptic proteins. Representative images from immunohistochemistry experiments to detect the vesicular gamma-aminobutyric acid (GABA) transporter [vesicular GABA transporter (vGAT); (A,B,E,F,I,J)] and the postsynaptic scaffold Gephyrin (A’,B’,E’,F’,I’,J’) on transverse trunk spinal cord sections of wild-type and fmr1 mutants at 24 hpf (A,B), 48 hpf (E,F), and 7 dpf (I,J). vGAT (cyan arrows) and Gephyrin expression (red arrows) is most concentrated in the lateral axon tracts. Apposition of vGAT and Gephyrin is shown in third panels (A”,B”,E”,F”,I”,J”), which represent vGAT puncta positioned <250 nm to Gephyrin puncta, and vice versa. Quantification of vGAT (C,G,K) and Gephyrin puncta (D,H,L) normalized to spinal cord area as well as the relative amount of vGAT or Gephyrin apposed to Gephyrin or vGAT, respectively. Cyan numbers in third panels represent the percentage of vGAT puncta apposed to Gephyrin to total vGAT, while red numbers represent the percentage of Gephyrin puncta apposed to vGAT to total Gephyrin. Forth panels (A”’,B”’,E”’,F”’,I”’,J”’) represent a zoom of synaptic protein apposition images (indicated by dashed boxes in third panels). The puncta size color code applies to the first and second panels, not apposition data. Dashed ovals in panel (A–B’) denote the edges of the spinal cord at 24 hpf. Scale bars = 10 μm (2 μm for apposition zoom panels). Aside from a Mann–Whitney test to compare 24 hpf Gephyrin apposition, all other statistical comparisons from unpaired t-tests. P-values indicated in graphs, where p < 0.05 is considered significant. See also Supplementary Figures 1, 2. |
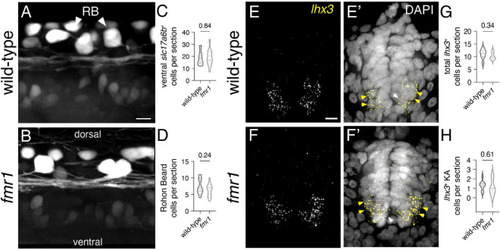
Fmrp does not regulate glutamatergic cell production. Representative lateral images of the spinal cord of live wild-type (A) and fmr1 mutant (B) embryos expressing slc17a6b:LoxP-DsRed-LoxP-EGFP, a glutamatergic neuron reporter, at 24 hpf. Quantification of slc17a6b+ cells in the ventral spinal cord [(C); two-tailed t-test], and slc17a6b+ Rohon–Beard (RB) cells in the dorsal cord [(D); two-tailed t-test]. RBs have large cell bodies and brightly express the reporter [arrowheads, (B)]. Representative images of fluorescent in situ hybridization (FISH) experiments to detect lhx3 expression in transverse trunk spinal cord sections of wildtype (E) and fmr1 (F) embryos at 24 hpf. Presumptive lhx3+ V2a interneurons (INs) in the lateral region are indicated with yellow arrowheads and lhx3+ KA neurons adjacent the central canal are labeled by white arrowheads (E’,F’,E”,F”). Quantification of total lhx3+ cells [excluding KA; (G); two-tailed t-test] and lhx3+ KA cells per section [(H); two-tailed t-test]. lhx3 quantification reflects the average number of cells per section, averaged by embryo. Scale bars = 10 μm. P-values indicated in graphs, where p < 0.05 is considered significant. See also Supplementary Figure 3. |
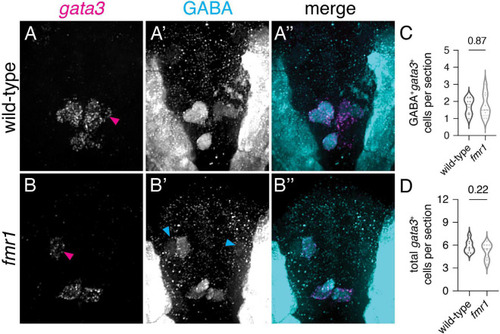
Excess GABAergic neurons in fmr1 embryos are not specified in the p2 progenitor domain. Representative images showing fluorescent RNA in situ hybridization to detect gata3 transcript in wild-type (A) and fmr1 mutant embryos (B) alongside immunohistochemistry for gamma-aminobutyric acid (GABA) (A’,B’) and merged images (A”,B”) at 24 hpf. Quantification of GABA+gata3+ V2b cells [(C); two-tailed t-test] and total gata3+ cells at 24 hpf [(D); two-tailed t-test]. GABA+gata3+ V2b neurons marked with magenta arrows (A,B), GABA+gata3– cells indicated with cyan arrows (B’). Quantification reflects the average number of cells per section, averaged by embryo. Scale bar = 10 μm. P-values indicated in graphs, where p < 0.05 is considered significant. See also Supplementary Figure 3. EXPRESSION / LABELING:
|
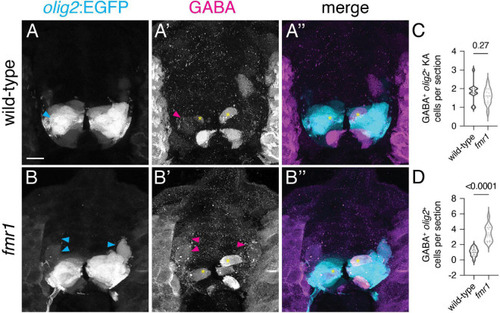
Surplus ventrolateral GABAergic neurons in fmr1 embryos are specified in the pMN progenitor domain. At 24 h post-fertilization, there are two populations of pMN-derived GABA+olig2+ cells in the ventral spinal cord, as shown through immunohistochemistry for gamma-aminobutyric acid (GABA) on transverse trunk spinal cord sections of Tg(olig2:EGFP) embryos: dorsal KA INs [yellow asterisks, (A’,A”,B’,B”)] and ventral lateral descending (VeLD) INs [cyan and magenta arrowheads, (A,A’,B,B’)]. Quantification of KA INs [(C); Mann–Whitney test] and VeLD INs [(D); two-tailed t-test] in wild-type and fmr1 embryos. Quantification reflects the average number of cells per section, averaged by embryo. Scale bar = 10 μm. P-values indicated in graphs, where p < 0.05 is considered significant. |

Increased early born ventral lateral descending (VeLD interneurons and GABAergic motor neurons of fmr1 embryos (A,B) Live lateral images of trunk spinal cord from embryos expressing mnx1:EGFP, a reporter of primary motor neurons and VeLD interneurons. Asterisks indicate presumptive VeLD interneurons, with large soma situated dorsal and rostral to primary motor neurons. (C) Quantification of the average number of EGFP+ cells per hemisegment at 24 hpf. Representative images of immunohistochemistry to detect gamma-aminobutyric acid (GABA) and Islet1 on transverse trunk spinal cord sections of mnx1:EGFP embryos at 24 hpf. mnx1 + cells (D,E) expressed a combination of the motor neuron marker Islet1 (D’,E’) and GABA (D”,E”). Quantification of mnx1+Isl1–GABA+ presumptive VeLD interneurons [(F); magenta arrows; two-tailed t-test], mnx1+Isl1+GABA– motor neurons [(G); cyan arrows; two-tailed t-test], and mnx1+Isl1+GABA+ motor neurons [(H); white arrows; two-tailed t-test]. Quantification reflects the average number of cells per section, averaged by embryo. Scale bars = 10 μm. P-values indicated in graphs, where p < 0.05 is considered significant. |