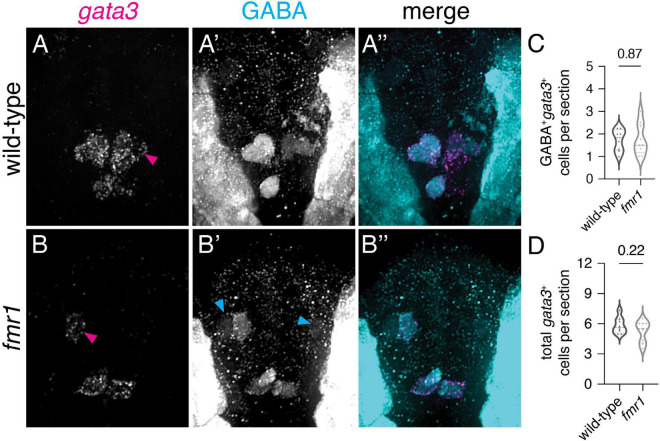
FIGURE 4 Excess GABAergic neurons in fmr1 embryos are not specified in the p2 progenitor domain. Representative images showing fluorescent RNA in situ hybridization to detect gata3 transcript in wild-type (A) and fmr1 mutant embryos (B) alongside immunohistochemistry for gamma-aminobutyric acid (GABA) (A’,B’) and merged images (A”,B”) at 24 hpf. Quantification of GABA+gata3+ V2b cells [(C); two-tailed t-test] and total gata3+ cells at 24 hpf [(D); two-tailed t-test]. GABA+gata3+ V2b neurons marked with magenta arrows (A,B), GABA+gata3– cells indicated with cyan arrows (B’). Quantification reflects the average number of cells per section, averaged by embryo. Scale bar = 10 μm. P-values indicated in graphs, where p < 0.05 is considered significant. See also Supplementary Figure 3.
Image
Figure Caption
Figure Data
Acknowledgments
This image is the copyrighted work of the attributed author or publisher, and
ZFIN has permission only to display this image to its users.
Additional permissions should be obtained from the applicable author or publisher of the image.
Full text @ Front. Neurosci.

