
- Title
-
P66Shc (Shc1) Zebrafish Mutant Line as a Platform for Testing Decreased Reactive Oxygen Species in Pathology
- Authors
- Haslem, L., Hays, J.M., Zhang, X.A., Hays, F.A.
- Source
- Full text @ J Cardiovasc Dev Dis
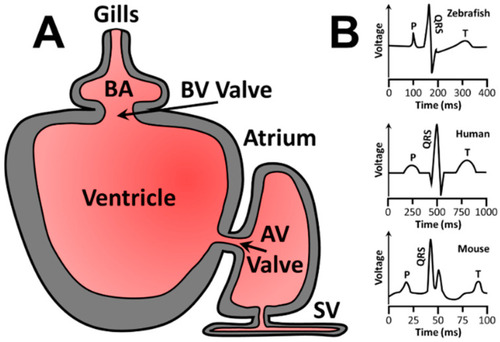
Zebrafish cardiac circulation diagram and representative ECG for zebrafish, humans, and mice. (A) Zebrafish cardiac circulation begins at the sinus venosus (SV), enters the atrium, passes through the atrioventricular (AV) valve, fills the ventricle, and is pushed through the bulbo-ventricular (BV) valve into the bulbus arteriosus (BA) before reaching the gills for oxygenation. (B) Representative ECGs of zebrafish (top), humans (middle), and mice (bottom). Human ECGs are more similar to zebrafish than mouse ECGs. P = p wave, or atrial depolarization. QRS = QRS complex or atrial repolarization combined with ventricle depolarization. T = T wave or ventricular repolarization. |
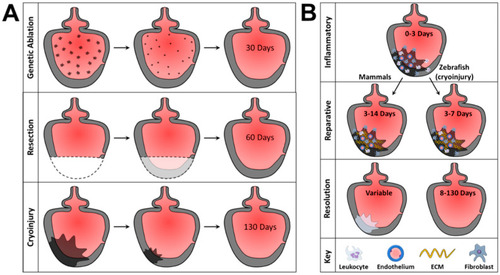
Damage patterns in MI models and MI wound repair process. (A) Representations of zebrafish MI models and their damage patterns. Genetic ablation targets only myocardium and is resolved in 30 days. Resection models are transmural but remove tissue that would otherwise require cellular debridement and cause extracellular matrix (ECM) protein deposition that is inconsistent with mammalian MI. Resection injury resolves in 60 days. Cryoinjury is a transmural injury model that closely resembles mammalian MI, requiring cellular debridement and showing ECM protein composition and deposition patterns like those observed in mammalian MI. (B) Stages of wound repair in mammalian and zebrafish cryoinjury MI by stage. The inflammatory stage lasts from 0 to 3 days of injury and is characterized by inflammatory cell recruitment and inflammatory responses governed by the innate immune system. The reparative phase lasts 3–14 days in mammals or 3–7 days in zebrafish cryoinjury models. During this stage, ECM deposition provides a scaffolding for wound resolution. Wound resolution ends with characteristic loss of cardiomyocytes, scarring, and decreased cardiac function in mammals, while zebrafish can regenerate lost cardiomyocytes from cryoinjury within 130 days of injury. |
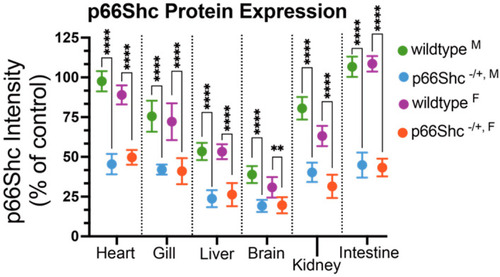
p66Shc protein expression in GFP+/+ (wildtype) and GFP+/+ p66Shc−/+ hypomorphic allele zebrafish. Heart, gill, liver, brain, kidney, and intestines were harvested from male (M) and female (F) zebrafish. Parental genotypes indicated in color (green and blue for male, purple and orange for female). **** = p-value < 0.0001, ** = p-value < 0.01, N = 7 independent fish for each measurement and presented as mean ± SD. |
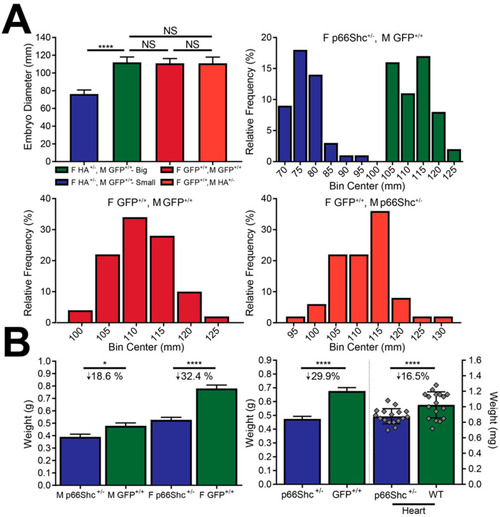
p66Shc hypomorphic allele embryo diameter and adult zebrafish mass. (A) Embryo diameter (top left panel) and embryo diameter frequency distribution of different parental crosses. p66Shc hypomorphic allele heterozygote females produce embryos with a bimodal size distribution that can be separated under a microscope. Size differences were significant and not observed when female WT (F GFP +/+) fish were bred with male WT (M GFP +/+) or male p66Shc+/− (M hypomorphic allele (HA) +/−). Parental genotypes are indicated by color and above their corresponding histograms. N = 50, **** = p < 0.0001, mean ± SD. (B) Whole fish weight differences (left panel) by gender and genotype. Males had a smaller mass decrease than females. Whole fish and heart mass differences (right panel), not gender stratified. N = 16 (hearts) or ≥ 36 (whole fish), * = p < 0.05, mean ± SD. Individual data points omitted for clarity. |
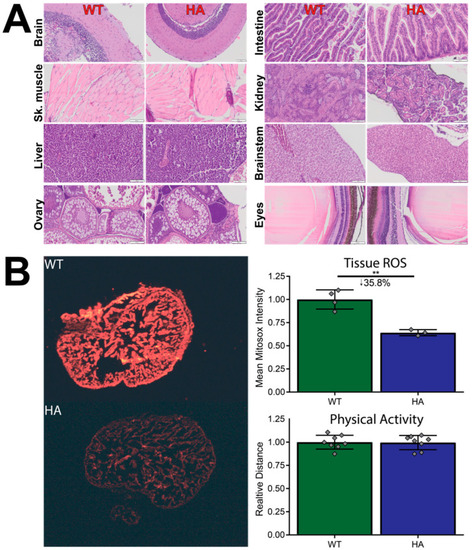
Tissue comparisons between WT and p66Shc hypomorphic allele zebrafish. (A) Representative H&E stains of WT and hypomorphic allele zebrafish organs. Organs do not show tissue-level abnormalities. (B) Physical activity is not affected in the p66Shc−/+ (HA) zebrafish line, but tissue ROS levels are significantly reduced. N = 8 for physical activity, 3–4 for tissue ROS. ** = p < 0.01, mean ± SD. Both images were uniformly contrast- and brightness-enhanced for clear visualization. |
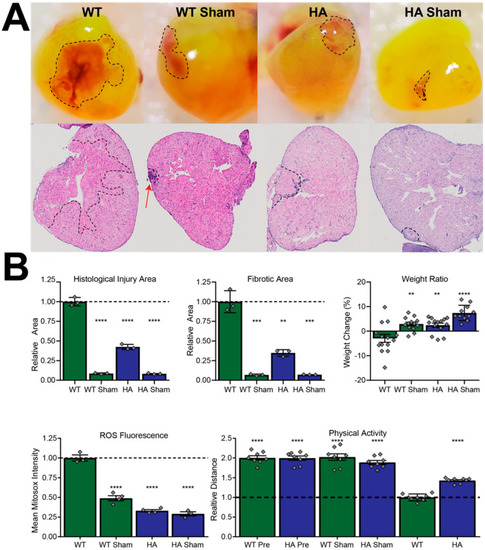
p66Shc hypomorphic allele improves MI outcome determinants in a ROS-dependent manner. (A) Representative stereomicroscopy images (top) and H&E stains (bottom) of resected hearts. (B) Quantification of zebrafish body mass effects, physical activity, and MI parameters from panel A. Hypomorphic allele zebrafish denoted as “HA”. **** = p-value < 0.0001, *** = p-value < 0.001, ** = p-value < 0.01, N = 7 independent fish for each measurement and presented as mean ± SD, N = 14 (weight ratio), N = 3 (injury and fibrotic area), N = 3 or 4 (ROS fluorescence), and N = 8 (physical activity). |
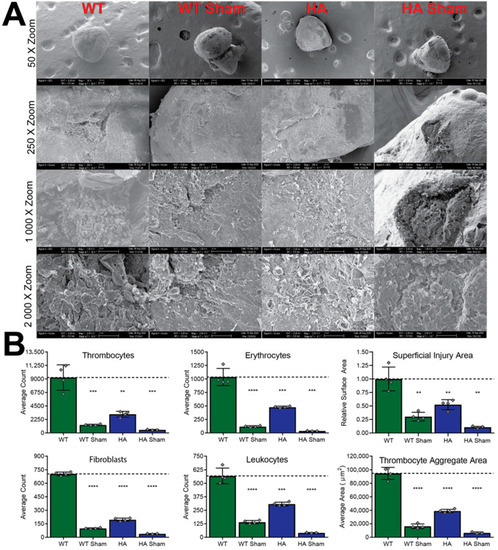
SEM cryoinjury imaging and associated quantifications. (A) Representative SEM imaging at four different zoom levels, illustrating differences between WT and hypomorphic allele (HA) groups. (B) Quantification of imaged parameters from panel A. **** = p-value < 0.0001, *** = p-value < 0.001, ** = p-value < 0.01. |