
Image
|
Figure Caption
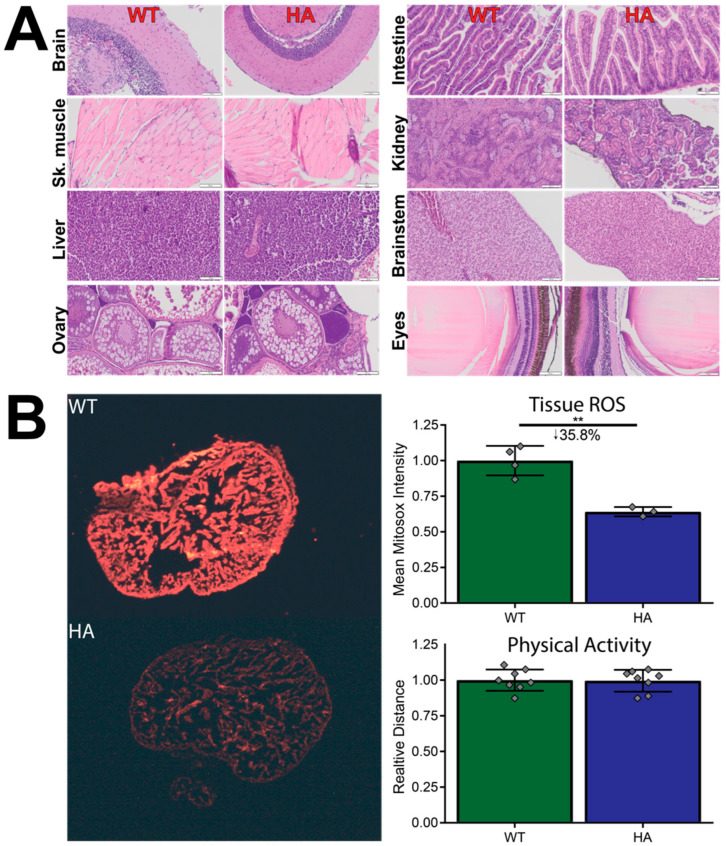
Figure 5 Tissue comparisons between WT and p66Shc hypomorphic allele zebrafish. (A) Representative H&E stains of WT and hypomorphic allele zebrafish organs. Organs do not show tissue-level abnormalities. (B) Physical activity is not affected in the p66Shc−/+ (HA) zebrafish line, but tissue ROS levels are significantly reduced. N = 8 for physical activity, 3–4 for tissue ROS. ** = p < 0.01, mean ± SD. Both images were uniformly contrast- and brightness-enhanced for clear visualization.
Acknowledgments
This image is the copyrighted work of the attributed author or publisher, and
ZFIN has permission only to display this image to its users.
Additional permissions should be obtained from the applicable author or publisher of the image.
Full text @ J Cardiovasc Dev Dis