
Figure 1
- ID
- ZDB-FIG-221211-147
- Publication
- Haslem et al., 2022 - P66Shc (Shc1) Zebrafish Mutant Line as a Platform for Testing Decreased Reactive Oxygen Species in Pathology
- Other Figures
- All Figure Page
- Back to All Figure Page
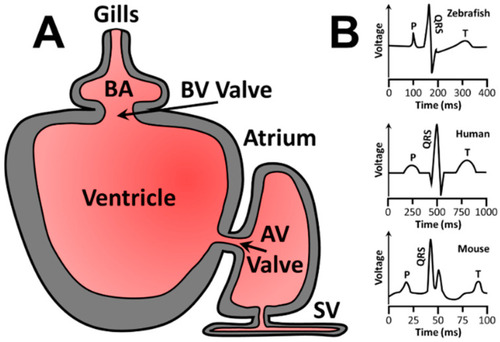
Zebrafish cardiac circulation diagram and representative ECG for zebrafish, humans, and mice. (A) Zebrafish cardiac circulation begins at the sinus venosus (SV), enters the atrium, passes through the atrioventricular (AV) valve, fills the ventricle, and is pushed through the bulbo-ventricular (BV) valve into the bulbus arteriosus (BA) before reaching the gills for oxygenation. (B) Representative ECGs of zebrafish (top), humans (middle), and mice (bottom). Human ECGs are more similar to zebrafish than mouse ECGs. P = p wave, or atrial depolarization. QRS = QRS complex or atrial repolarization combined with ventricle depolarization. T = T wave or ventricular repolarization. |