- Title
-
Fluxapyroxad disrupt erythropoiesis in zebrafish (Danio rerio) embryos
- Authors
- Chen, X., Qiu, T., Pan, M., Xiao, P., Li, W.
- Source
- Full text @ Ecotoxicol. Environ. Saf.
|
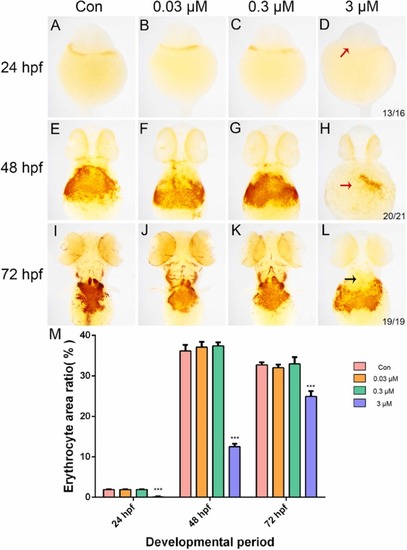
Fig. 1. Effect of fluxapyroxad on erythropoiesis in zebrafish. (A–D): Dorsal views of 24 hpf embryos. (E–H): Dorsal views of 48 hpf embryos. (I–L): Dorsal views of 72 hpf embryos. (M): Quantitative analysis of the erythrocyte area of in zebrafish. Erythrocyte area ratio (o-dianisidine signal area/yolk area). * ** P < 0.001. PHENOTYPE:
|
|
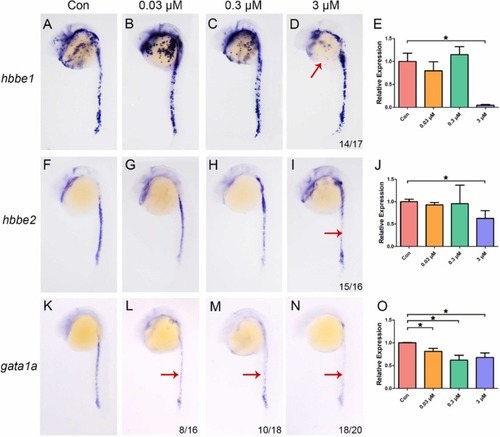
Fig. 2. Fluxapyroxad affects the expression of erythrocyte-associated markers in zebrafish embryos at 24 hpf. (A–E): Data for gene hbbe1. (F–J): Data for gene hbbe2. (K–O): Data for gene gata1a. The numbers in D, I, and L–N indicate the number of embryos that expression levels changed. * P < 0.05. |
|
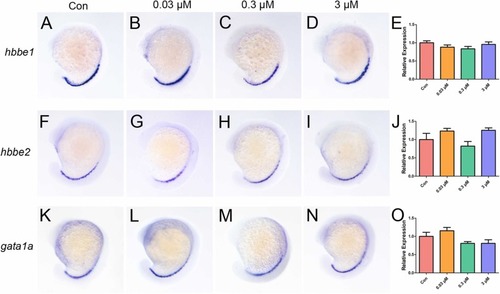
Fig. 3. Effect of fluxapyroxad on the expression of erythrocyte-associated markers at 16 hpf. (A–E): Data for gene hbbe1. (F–J): Data for gene hbbe2. (K–O): Data for gene gata1a. EXPRESSION / LABELING:
|
|
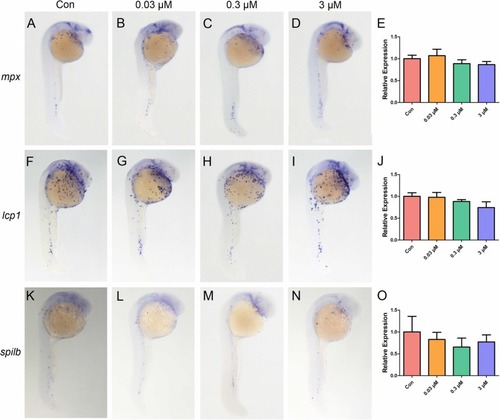
Fig. 4. Effect of fluxapyroxad on the expression of myeloid lineage markers at 24 hpf. (A–E): Data for gene mpx. (F–J): Data for gene lcp1. (K–O): Data for gene spi1b. EXPRESSION / LABELING:
|
|
Fig. 5. Effects of fluxapyroxad on neutrophil production in zebrafish embryos at 3 dpf. (A): DMSO treated embryos. (B): 0.03 μM fluxapyroxad treated embryos. (C) 0.3 μM fluxapyroxad treated embryos. (D): 3 μM fluxapyroxad treated embryos. (E): Quantitative analysis of the neutrophil staining area (Sudan Black B signal area/tail area). PHENOTYPE:
|
|
Fig. 6. Effects of fluxapyroxad on macrophage generation in zebrafish embryos at 3 dpf. (A): DMSO treated embryos. (B): 0.03 μM fluxapyroxad treated embryos. (C): 0.3 μM fluxapyroxad treated embryos. (D): 3 μM fluxapyroxad treated embryos. (E): Quantitative analysis of the macrophage area (Neutral red signal area/head area). PHENOTYPE:
|


