- Title
-
Depletion of stearoyl-CoA desaturase (scd) leads to fatty liver disease and defective mating behavior in zebrafish
- Authors
- Xu, S.S., Li, Y., Wang, H.P., Chen, W.B., Wang, Y.Q., Song, Z.W., Liu, H., Zhong, S., Sun, Y.H.
- Source
- Full text @ Zool Res
|
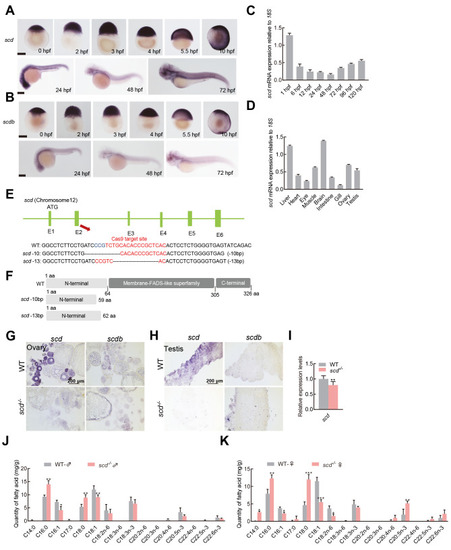
A: Spatiotemporal expression profiles of scd gene detected by embryo in situ hybridization. B: Spatiotemporal expression profiles of scdb gene detected by embryo in situ hybridization. C: RT-qPCR analysis of spatiotemporal expression profile of zebrafish scd gene, with 18S used as a reference gene. D: RT-qPCR analysis of scd expression in different adult tissues. E: Schematic of zebrafish scd genome locus and gRNA target information. gRNA target sequences are highlighted in red. bp, base pairs; scd -13, homozygous mutant line ( scd -/- ) with 13 bp (TGCACACCCGCTC) deletion in exon 2 of scd gene; scd -10, homozygous mutant line with 10 bp (ATCCCGTCTG) deletion in exon 2. F: Predicted WT protein and mutated protein for two mutant alleles. G: Detection of expression patterns of scd and scdb in ovary by chemical in situ hybridization of sections. H: Detection of expression patterns of scd and scdb in testis by chemical in situ hybridization of sections. I: RT-qPCR analysis of scd transcriptional expression level in scd -/- liver . J: Determination of fatty acid content in WT♂and scd -/- ♂ . K: Determination of fatty acid content in WT♀and scd -/- ♀. All values are mean± SEM. Student t-tests were used. *: P<0.05; **: P<0.01; ***: P<0.001. |
|
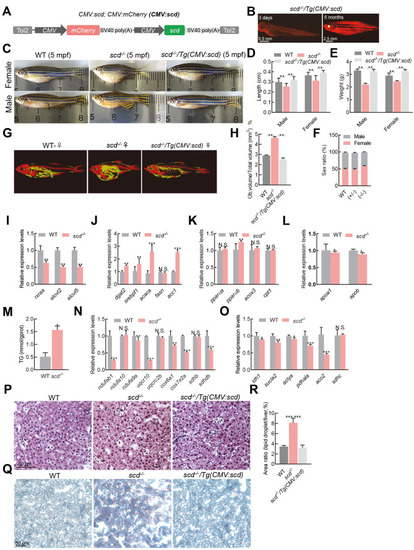
A: Schematic of scd expression vector CMV:scd. B: scd -/- /Tg(CMV:scd) fish at 3 dpf and 5 months old. C: According to morphological analysis, WT females were silver and black, with a round body, while scd -/- females were similar in color but had a shorter body and larger abdomen. WT males were orange and black, with a slender body, while scd -/- males were similar in color, but shorter in stature with a curved back. D: Body length was significantly shorter in scd -/- mutants ( n=9) than in WT and CMV-scd fish ( n=9) at 6 mpf. E: Bodyweight was significantly lighter in scd -/- mutants ( n=9) than in WT and CMV-scd fish ( n=9) at 6 mpf. F: There was no significant difference in sex ratio between WT fish ( n=3 groups; no less than 30 in each group) and heterozygous mutants ( n=3 groups; no less than 30 in each group) or WT fish and homozygous mutants ( n=3 groups; no less than 30 in each group). G: Micro-CT scan image of WT and scd -/- fish. H: Comparison of fat-to-total volume ratio in WT and scd -/- fish. I: Expression levels of rxraa, elovl2, and elovl5 were significantly down-regulated in scd -/- livers compared to WT livers (RT-qPCR analysis) J: Expression levels of fatty acid synthesis-related genes dgat2, srebf1, acaca, fasn, and acc1 were significantly higher in scd -/- liver than in WT liver at 3 mpf (RT-qPCR analysis). K: Expression levels of oxidation-related genes pparαa, pparαb, acox3, and cpt1 in WT and scd -/- livers at 3 mpf (RT-qPCR analysis). L: Expression levels of transfer-related genes apoa1 and apob in WT and scd -/- livers at 3 mpf (RT-qPCR analysis). M: Triglyceride content in WT and scd -/- livers. N: Expression levels of oxidative phosphorylation-related genes ndufab1, ndufa10, and ndufa9a in WT and scd -/- livers at 3 mpf (RT-qPCR analysis). O: Expression levels of tricarboxylic acid cycle-related genes idh1, sucla2, and aclya in the WT and scd -/- livers at 3 mpf (RT-qPCR analysis). P: H&E staining of liver sections from WT, scd -/- , and scd -/- /Tg(CMV:scd) fish ( n=3, two sections for each sample) at 3 mpf. Scale bars, 50 μm. Q: Oil Red staining of liver sections from WT, scd -/- , and scd -/- /Tg(CMV:scd) fish ( n=3, two sections for each sample) at 3 mpf. Scale bars, 50 μm. R: Quantitative average area of lipid droplets ( n=3, two sections for each sample). There were more lipid droplets in scd -/- liver than in WT liver. All values are mean±SEM. Student t-tests were used. *: P<0.05; **: P<0.01; ***: P<0.001; ns: No significance. |
|
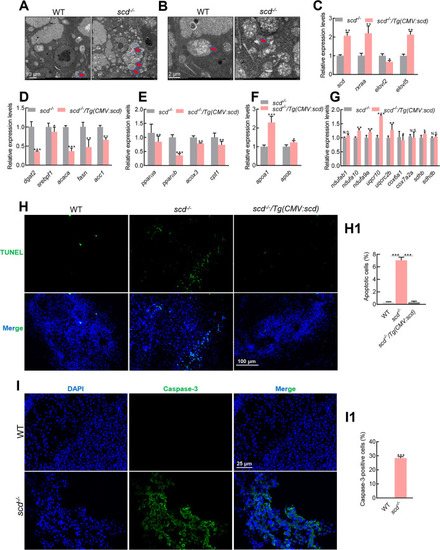
A: Scanning electron micrographs of WT and scd -/- liver sections showing increased lipid droplets in mutant livers. Scale bars: 10 μm. B: Scanning electron micrographs of WT and scd -/- liver sections showing shrunken mitochondria in mutant liver cells. Scale bars, 2 μm. C: Expression levels of scd, rxraa, elovl2, and elovl5 in scd -/- and scd -/- /Tg(CMV:scd) livers at 3 mpf (RT-qPCR). D: Expression levels of fatty acid synthesis-related genes dgat2, srebf1, acaca, fasn, and acc1 were significantly lower in scd -/- /Tg(CMV:scd) livers than in scd -/- livers at 3 mpf (RT-qPCR). E: Expression levels of oxidation-related genes pparαa, pparαb, acox3, and cpt1 in scd -/- and scd -/- /Tg(CMV:scd) livers at 3 mpf (RT-qPCR). F: Expression levels of transfer-related genes apoa1 and apob in scd -/- and scd -/- /Tg(CMV:scd) livers at 3 mpf (RT-qPCR). G: Expression levels of oxidative phosphorylation-related genes ndufab1, ndufa10, and ndufa9a in scd -/- and scd -/- /Tg(CMV:scd) livers at 3 mpf (RT-qPCR). H: Detection of liver cell apoptosis in WT, scd -/- , and scd -/- /Tg(CMV:scd) fish ( n=3, two sections for each sample) at 3 mpf with TUNEL staining, with DAPI blue indicating nucleus and TUNEL green indicating apoptosis signal. Scale bars: 100 μm. H1: Number of apoptotic cells (%) ( n=3, two sections for each sample). I: Immunofluorescence detection of WT and scd -/- liver sections ( n=3, two sections for each sample) with Caspase-3 antibody. Scale bars: 25 μm. I1: Number of Caspase-3-positive cells (%) ( n=3, two sections for each sample). All values are mean± SEM. Student t-tests were used. *: P<0.05; **: P<0.01; ***: P<0.001; ns: No significance. |
|
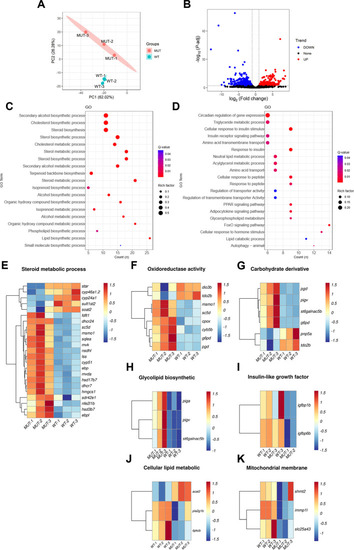
A: PCA cluster analysis of WT and mutant zebrafish liver samples. B: Volcano plot showing DEGs in two sets of samples, where blue represents down-regulated genes, red represents up-regulated genes, black represents genes with no significant difference, and each point represents a gene. C: KEGG analysis of up-regulated DEGs showing significantly enriched pathways D: KEGG analysis of down-regulated DEGs showing significantly enriched pathways. E: Heatmap of DEGs associated with steroid metabolism. F: Heatmap of DEGs associated with oxidoreductase activity. G: Heatmap of DEGs associated with carbohydrate derivative. H: Heatmap of DEGs associated with glycolipid biosynthesis. I: Heatmap of DEGs associated with insulin-like growth factor binding. J: Heatmap of DEGs related to cellular lipid metabolism. K: Heatmap of mitochondrial membrane-associated DEGs. A: PCA cluster analysis of WT and mutant zebrafish liver samples. B: Volcano plot showing DEGs in two sets of samples, where blue represents down-regulated genes, red represents up-regulated genes, black represents genes with no significant difference, and each point represents a gene. C: KEGG analysis of up-regulated DEGs showing significantly enriched pathways D: KEGG analysis of down-regulated DEGs showing significantly enriched pathways. E: Heatmap of DEGs associated with steroid metabolism. F: Heatmap of DEGs associated with oxidoreductase activity. G: Heatmap of DEGs associated with carbohydrate derivative. H: Heatmap of DEGs associated with glycolipid biosynthesis. I: Heatmap of DEGs associated with insulin-like growth factor binding. J: Heatmap of DEGs related to cellular lipid metabolism. K: Heatmap of mitochondrial membrane-associated DEGs. |
|
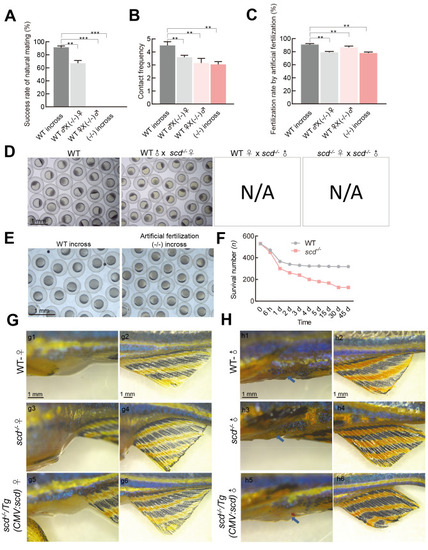
A: Success rates of natural mating of WT♂×WT♀, WT♂×(-/-)♀, WT♀×(-/-)♂, and (-/-)♂×(-/-)♀ were detected ( n=10 pairs of fish for each group). B: Contact frequencies between WT♂×WT♀, WT♂×(-/-)♀, WT♀×(-/-)♂, and (-/-)♂×(-/-)♀were detected ( n=3 pairs of fish for each group). C: Fertilization rate calculated from in vitro fertilization using WT sperm+WT egg (WT in-cross), scd -/- egg ([-/-]♀)+WT sperm (WT♂), scd -/- sperm ([-/-]♂)+WT egg (WT♀), and scd -/- sperm ([-/-]♂)+ scd -/- egg ([-/-]♀) ( n=3 pair groups were analyzed for each). D: Four natural fertilization groups. E: Representative images from in vitro fertilization of scd -/- sperm ([-/-]♂)+ scd -/- egg ([-/-]♀) showing natural fertilized egg development. F: Survival rate of scd -/- mutant larvae was ~30%, significantly lower than that of WT larvae. G, H: Morphological analysis of secondary sexual characteristics. WT females had a rounded body shape, silver and black body color, white anal fin (g2), and large extended genital papilla (g1). However, scd -/- females had shorter and rounded body shape, silver and black body color, white anal fin (g4), and extended genital papilla (g3). The scd -/- /Tg(CMV:scd) and WT females had the same secondary sexual characteristics (g5, g6). WT males had slim body shape, orange and black body color, orange and black anal fin (h2), and small genital papilla (h1). However, scd -/- males had shorter and curved body shape, orange and black body color, orange and black anal fin (h4), and no genital papilla (h3). The scd -/- /Tg(CMV:scd) and WT males had the same secondary sexual characteristics (h5, h6). All values are mean± SEM. Student t-tests were used. **: P<0.01; ***: P<0.001. N/A: Not available. |
|
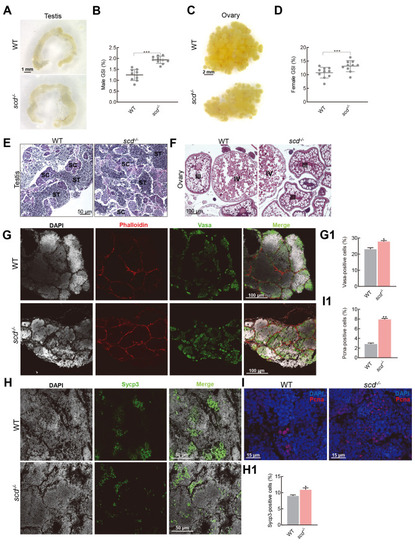
A: Morphological features of scd -/- gametes, size and shape of scd -/- male testis. Scale bars: 1 mm. B, D: GSI (gonad weight/body weight×100%) of males (B) and females (D) was significantly increased in scd -/- mutants compared to WT fish. GSI: Gonadosomatic index. C: Size and shape of scd -/- female ovary. Scale bars: 2 mm. E, F: H&E staining of testis (E) and ovary (F) sections from WT and scd -/- fish ( n=3, two sections for each sample) at 3 mpf. Scale bars: 50 μm (E), 100 μm (F). SC, spermatocyte; ST, spermatid. G: Immunofluorescence staining with Vasa antibody of WT and scd -/- testes at 3 mpf ( n=3, three sections for each sample). Scale bars: 100 μm. G1: Quantitative results of average area of Vasa-positive cells ( n=3, three sections for each sample). There were more germ cells in the scd -/- testis than in WT testis. H: Immunofluorescence staining with Sycp3 antibody of WT and scd -/- testes at 3 mpf ( n=3, three sections for each sample). Scale bars: 50 μm. H1: Quantitative results of average area of Sycp3-positive cells ( n=3, three sections for each sample). There were more meiotic cells in scd -/- testis than in WT testis. I: Immunofluorescence staining with Pcna antibody of WT and scd -/- testes at 3 mpf ( n=3, three sections for each sample). Scale bars: 15 μm. I1: Quantitative results of average area of Pcna-positive cells ( n=3, three sections for each sample). There were more mitotic cells in scd -/- testis than in WT testis. All values are mean± SEM. Student t-tests were used. *: P<0.05; **: P<0.01; ***: P<0.001. |
|
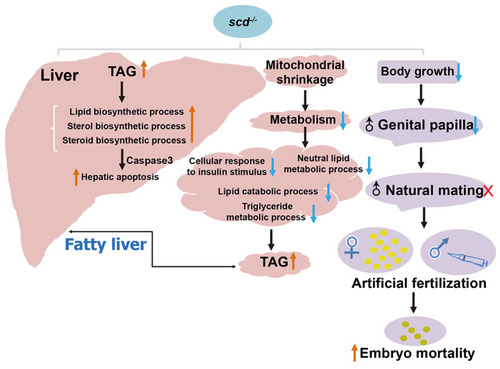
Graphic summary of scd regulation of lipid homeostasis and sexual behavior |

