
Fig. 2
- ID
- ZDB-FIG-230331-170
- Publication
- Xu et al., 2023 - Depletion of stearoyl-CoA desaturase (scd) leads to fatty liver disease and defective mating behavior in zebrafish
- Other Figures
- All Figure Page
- Back to All Figure Page
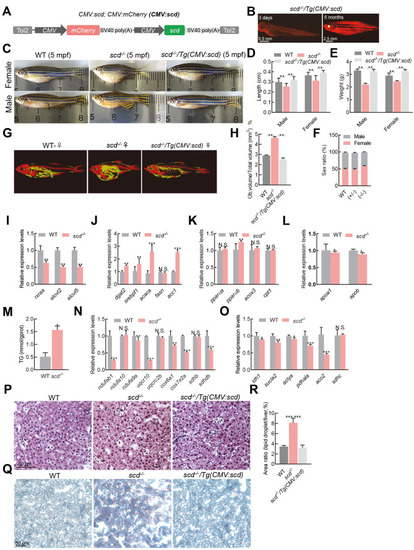
A: Schematic of scd expression vector CMV:scd. B: scd -/- /Tg(CMV:scd) fish at 3 dpf and 5 months old. C: According to morphological analysis, WT females were silver and black, with a round body, while scd -/- females were similar in color but had a shorter body and larger abdomen. WT males were orange and black, with a slender body, while scd -/- males were similar in color, but shorter in stature with a curved back. D: Body length was significantly shorter in scd -/- mutants ( n=9) than in WT and CMV-scd fish ( n=9) at 6 mpf. E: Bodyweight was significantly lighter in scd -/- mutants ( n=9) than in WT and CMV-scd fish ( n=9) at 6 mpf. F: There was no significant difference in sex ratio between WT fish ( n=3 groups; no less than 30 in each group) and heterozygous mutants ( n=3 groups; no less than 30 in each group) or WT fish and homozygous mutants ( n=3 groups; no less than 30 in each group). G: Micro-CT scan image of WT and scd -/- fish. H: Comparison of fat-to-total volume ratio in WT and scd -/- fish. I: Expression levels of rxraa, elovl2, and elovl5 were significantly down-regulated in scd -/- livers compared to WT livers (RT-qPCR analysis) J: Expression levels of fatty acid synthesis-related genes dgat2, srebf1, acaca, fasn, and acc1 were significantly higher in scd -/- liver than in WT liver at 3 mpf (RT-qPCR analysis). K: Expression levels of oxidation-related genes pparαa, pparαb, acox3, and cpt1 in WT and scd -/- livers at 3 mpf (RT-qPCR analysis). L: Expression levels of transfer-related genes apoa1 and apob in WT and scd -/- livers at 3 mpf (RT-qPCR analysis). M: Triglyceride content in WT and scd -/- livers. N: Expression levels of oxidative phosphorylation-related genes ndufab1, ndufa10, and ndufa9a in WT and scd -/- livers at 3 mpf (RT-qPCR analysis). O: Expression levels of tricarboxylic acid cycle-related genes idh1, sucla2, and aclya in the WT and scd -/- livers at 3 mpf (RT-qPCR analysis). P: H&E staining of liver sections from WT, scd -/- , and scd -/- /Tg(CMV:scd) fish ( n=3, two sections for each sample) at 3 mpf. Scale bars, 50 μm. Q: Oil Red staining of liver sections from WT, scd -/- , and scd -/- /Tg(CMV:scd) fish ( n=3, two sections for each sample) at 3 mpf. Scale bars, 50 μm. R: Quantitative average area of lipid droplets ( n=3, two sections for each sample). There were more lipid droplets in scd -/- liver than in WT liver. All values are mean±SEM. Student t-tests were used. *: P<0.05; **: P<0.01; ***: P<0.001; ns: No significance. |