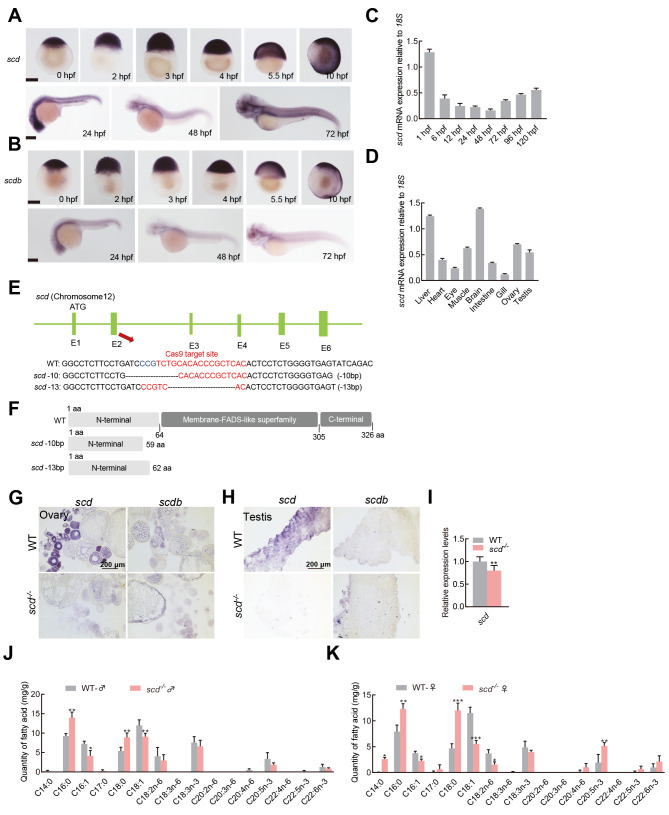
Fig. 1
A: Spatiotemporal expression profiles of scd gene detected by embryo in situ hybridization. B: Spatiotemporal expression profiles of scdb gene detected by embryo in situ hybridization. C: RT-qPCR analysis of spatiotemporal expression profile of zebrafish scd gene, with 18S used as a reference gene. D: RT-qPCR analysis of scd expression in different adult tissues. E: Schematic of zebrafish scd genome locus and gRNA target information. gRNA target sequences are highlighted in red. bp, base pairs; scd -13, homozygous mutant line ( scd -/- ) with 13 bp (TGCACACCCGCTC) deletion in exon 2 of scd gene; scd -10, homozygous mutant line with 10 bp (ATCCCGTCTG) deletion in exon 2. F: Predicted WT protein and mutated protein for two mutant alleles. G: Detection of expression patterns of scd and scdb in ovary by chemical in situ hybridization of sections. H: Detection of expression patterns of scd and scdb in testis by chemical in situ hybridization of sections. I: RT-qPCR analysis of scd transcriptional expression level in scd -/- liver . J: Determination of fatty acid content in WT♂and scd -/- ♂ . K: Determination of fatty acid content in WT♀and scd -/- ♀. All values are mean± SEM. Student t-tests were used. *: P<0.05; **: P<0.01; ***: P<0.001.

