FIGURE SUMMARY
Title

Unraveling Differential Transcriptomes and Cell Types in Zebrafish Larvae Intestine and Liver

Authors
Gao, Y., Jin, Q., Gao, C., Chen, Y., Sun, Z., Guo, G., Peng, J.
Source
Full text @ Cells

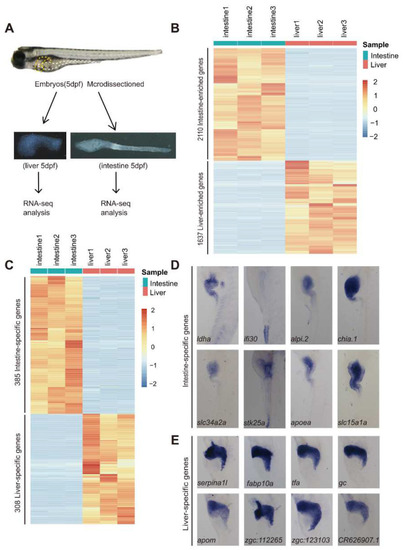
Identification of DEGs between the 5 dpf larval intestine and liver by RNA-seq analysis. (A) Flow chart showing the micro-dissection of the intestinal tube and liver bud from the zebrafish embryos at 5 dpf. The intestinal tube and liver bud are outlined with white and yellow dashed lines, respectively, in the embryo. (B) Heatmap showing the hierarchical clustering of the 2110 intestine-enriched and 1637 liver-enriched DEGs in the three intestine and three liver RNA-seq samples. (C) Heatmap showing the hierarchical clustering of the 385 intestine-specific and 308 liver-specific genes. (D,E) WISH showing the expression of 8 intestine-specific genes (D) and 8 liver-specific genes (E). Note that the ifi30 transcripts were enriched in the hindgut. The abbreviations of gene names followed the ENSEMBL naming system.

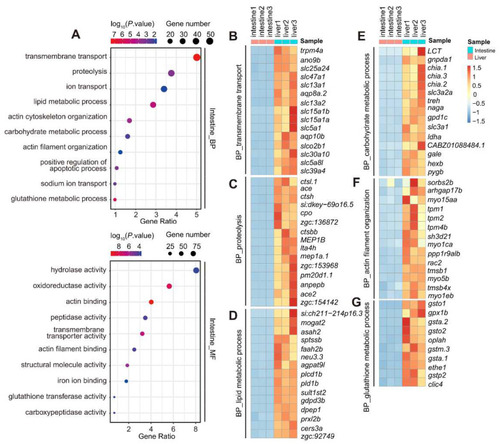
GO analysis of the 2110 intestine-enriched DEGs identified at 5 dpf. (A) GO analysis of the 2110 intestine-enriched DEGs under the GO_BP (upper panel) and GO_MF (lower panel) terms. Top 10 categories are shown here. (BG) Heatmap showing the hierarchical clustering of representative DEGs in the categories (chosen from the top 10 under the GO_BP term) of ‘transmembrane transport’ (B), ‘proteolysis’ (C), ‘lipid metabolic process’ (D), ‘carbohydrate metabolic process’ €, ‘actin cytoskeleton/filament organization’ (F) and ‘glutathione metabolic pathway’ (G) in the three intestine and three liver RNA-seq samples.

GO analysis of the 1637 liver-enriched DEGs identified at 5dpf. (A) GO analysis of the 1637 liver-enriched DEGs under the GO_BP (upper panel) and GO_MF (lower panel) terms. Top 10 categories are shown here. (BF) Hierarchical clustering heatmap comparing representative genes in the categories of ‘lipid metabolic process’ (B), ‘negative regulation of endopeptidase activity’ (C), ‘blood coagulation’ (D) and ‘complement activity’ (E) under the GO_BP term and ‘heme/oxygen binding’ under the GO_MF term (F). These categories were among the top 10 under the GO_BP or GO_MF terms.

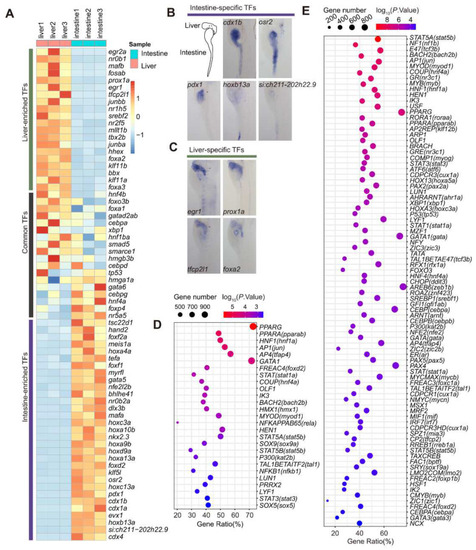
Mining TFs regulating the expression of intestine- and liver-enriched genes at 5 dpf. (A) Heatmap showing the hierarchical clustering of the 32 intestine-enriched, 19 liver-enriched and 18 representatives of the commonly shared TFs. (B,C) WISH showing the expression of 5 intestine-enriched and 4 liver-enriched TFs at 5 dpf. (D,E) List of putative TFs identified by TFBS analysis on David (https://david.ncifcrf.gov/tools.jsp) to regulate the expression of 2110 intestine-enriched (D) and 1637 liver-enriched genes (E). The number of genes presumably regulated by each TF and the relevant p-value are as indicated (p-value < 0.01). The names of the human TFs are provided together with a bracket showing the name of corresponding zebrafish TF (following the ENSMBL naming system).

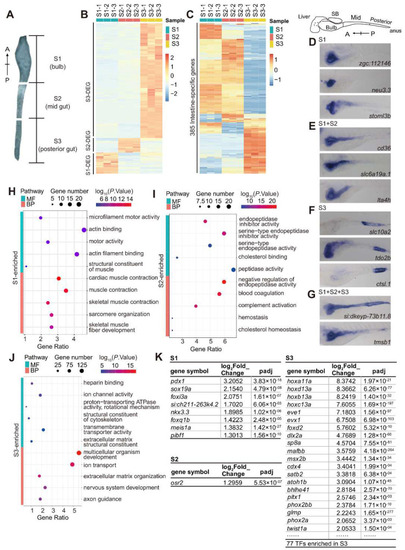
RNA-seq analysis of the gene expression profiles in the anterior (S1), middle (S2) and posterior regions (S3) of the intestine at 5 dpf. (A) Graph showing the region covered by the S1, S2 and S3 intestine fragments. (B) Hierarchical clustering heatmap comparing the 452 S1-enriched, 309 S2-enriched and 2449 S3-enriched DEGs among the three S1, S2 and S3 RNA-seq samples at 5 dpf. (C) Hierarchical clustering heatmap showing the distribution of 385 intestine-specific genes within the three S1, S2 and S3 RNA-seq samples at 5dpf. (DG) WISH showing the expression of representative genes in the regions of S1 (intestinal bulb) (D), S1 + S2 (bulb + mid-intestine) (E), S3 (hindgut) (F) and S1+S2+S3 (entire intestinal tube) (G). (HJ) GO analysis of the 452 S1-enriched (H), 309 S2-enriched (I) and 2449 S3-enriched (J) genes under the GO_BP and GO_MF terms. The top 5 categories are provided. (K) Information for the 8 S1-enriched, 1 S2-enriched and representatives of the 77 S3-enriched TF genes identified by RNA-seq.

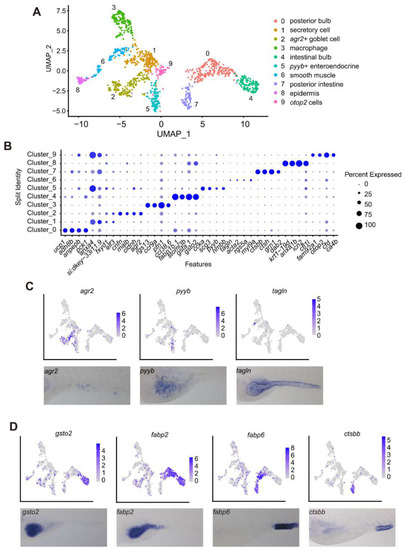
scRNA-seq analysis identified 10 cell types in the WT intestine at 5 dpf. (A) Visualization of integrated unsupervised clustering of cells in the UMAP plot of the sequenced 1229 cells from the WT intestines (left), together with cell annotations (right). (B) Dot plot of 4 marker genes for each cell cluster (cluster 0–cluster 9) for cell type annotation. (C,D) Feature plot together with WISH showing the expression of feature genes in the goblet (agr2), enteroendocrine (pyyb) and smooth muscle cells (tagln) (C), and in the intestinal bulb (gsto2), posterior bulb plus mid-intestine (fabp2, fabp6) and hindgut (ctsbb) cells (D).

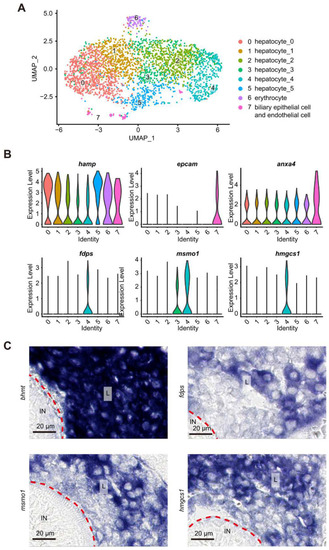
scRNA-seq analysis identified 8 cell clusters in the WT liver at 5 dpf. (A) Visualization of integrated unsupervised clustering of cells in the UMAP plot of the sequenced 3045 cells from the WT liver. (B) Violin graph showing the expression of hamp in all cell types, of faps and hmgcs1 in cluster 4, of msmo1 in both cluster 3 and 4 cells and of epcam in cluster 7 (cholangiocytes). (C) Sections of embryos after WISH using the probes for detecting the transcripts of bhmt (pan-hepatocyte marker), faps, hmgcs1 and msmo1. Note that bhmt was expressed abundantly in the liver bud, whereas faps, hmgcs1 and msmo1 were expressed only in a proportion of cells in the liver bud. A red dashed line separates the liver region (L) and intestinal lumen (IN).

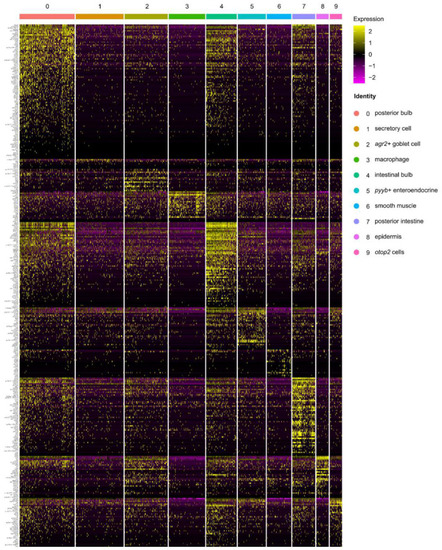
Cellular expression specificities of the 385 intestine-specific genes. Heatmap showing the expression of the 375 intestine-specific genes (10 genes were not detected by the intestine scRNA-seq) at the single-cell level in each cell cluster identified by the intestine scRNA-seq.

Acknowledgments
This image is the copyrighted work of the attributed author or publisher, and ZFIN has permission only to display this image to its users. Additional permissions should be obtained from the applicable author or publisher of the image. Full text @ Cells