|
Figure 5
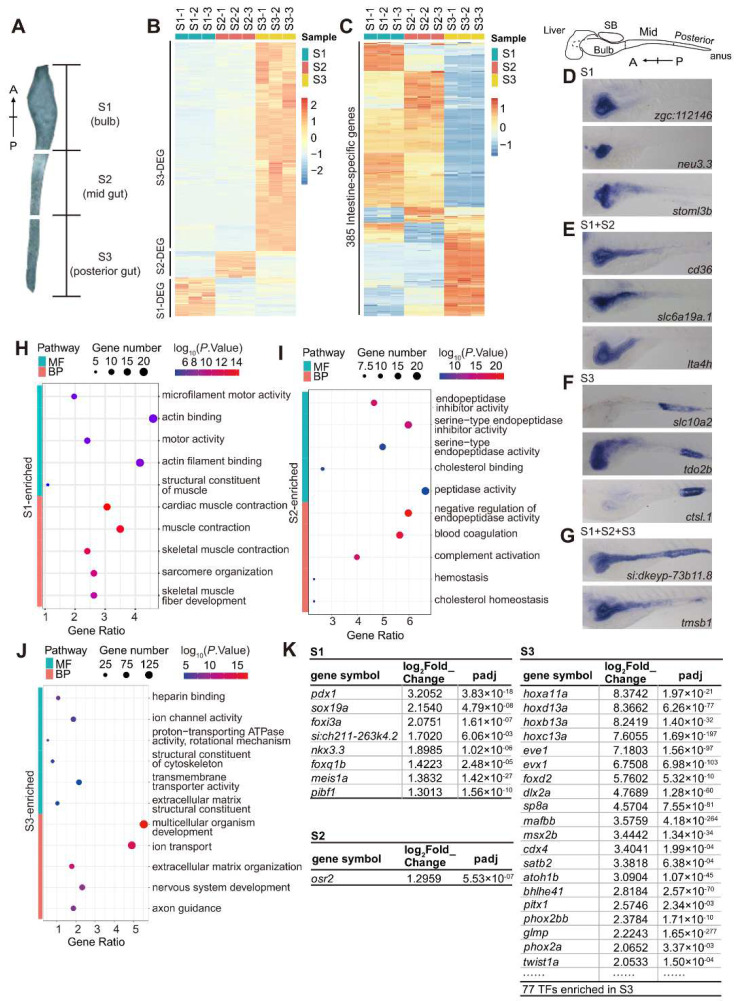
RNA-seq analysis of the gene expression profiles in the anterior (S1), middle (S2) and posterior regions (S3) of the intestine at 5 dpf. (

|
|
Figure 5
RNA-seq analysis of the gene expression profiles in the anterior (S1), middle (S2) and posterior regions (S3) of the intestine at 5 dpf. (