
- Title
-
Brain milieu induces early microglial maturation through the BAX-Notch axis
- Authors
- Zhao, F., He, J., Tang, J., Cui, N., Shi, Y., Li, Z., Liu, S., Wang, Y., Ma, M., Zhao, C., Luo, L., Li, L.
- Source
- Full text @ Nat. Commun.
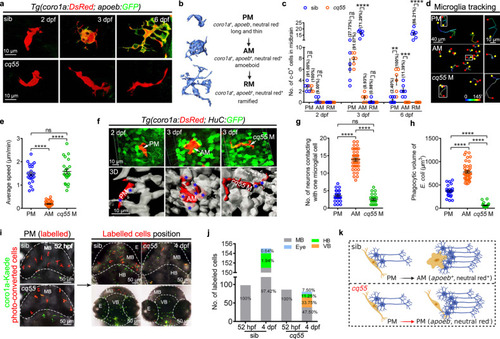
Microglial differentiation in a larval zebrafish midbrain.
a Representative images of midbrain microglial cells. b Zebrafish microglial development process. c The number and proportion of PM, AM and RM in midbrains (2 dpf: sib and cq55: n = 5; 3 dpf: sib and cq55: n = 6; 6 dpf: sib: n = 7, cq55: n = 6). Each dot denotes one fish. d The movement trajectory of c-D+ cells during 145 min. Each line represents one cell. The right panels are the enlarged images of boxed cells. The yellow circle and red square indicates start and end points, respectively. e The movement speed of c-D+ cells in d (n = 23 PM, 41 AM and 22 cq55 M from 6 fish per group). f Representative images (top) and 3D reconstructions (bottom) of c-D+ PM, AM or cq55 M (red) contacting HuC-GFP+ neurons (green and white colors in top and bottom panels). White arrows and blue asterisks mark the c-D+ cells and touched neurons. g The numbers of H-G+ neurons contacting PM, AM or cq55 M (n = 24 PM from 6 fish; n = 40 AM from 5 fish; n = 24 cq55 M from 6 fish). h The volume of phagocytized E. coli (n = 23 PM from 6 fish; n = 40 AM from 5 fish; n = 23 cq55 M from 6 fish). i Imagings of c-K+ PM (left panel). Coronal (right top) and transverse (right bottom) views of red c-K+ cells at 4 dpf. j The number and proportion of red c-K+ cells in different regions in (i) (n = 10 per group). k Schematic overview of microglia phenotypes, created with BioRender.com. sib siblings, M microglia, PM pre-microglia, AM amoeboid microglia, RM ramified microglia, c-D coro1a-DsRed, c-K coro1a-Kaede, MB midbrain, HB hindbrain, VB ventral brain, E eye. The numbers (c) and (j) indicate the average percentage. Each dot in (e), (g), and (h) represents one cell. Error bars, mean ± SEM. **P < 0.01; ***P < 0.001; ****P < 0.0001; ns no significant, Unpaired two-tailed Student’s t test. Source data are provided as a Source Data file. |
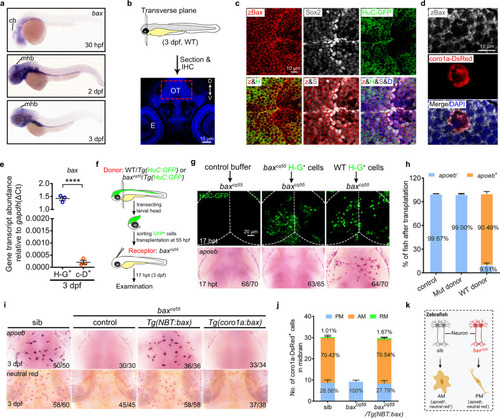
Bax is expressed in neurons and non-cell-autonomously regulates microglial maturation.
a WISH of bax in 30 hpf, 2 dpf, and 3 dpf zebrafish embryos. b Schematic illustration of the anatomical position and observational region (red square) in (c) and (d), created with photoshop CS6. c, d Immunofluorescence of zBax (z) with Sox2 (S) and HuC-GFP (H) (c) or coro1a-Dsred (d) in 3 dpf OT region. e qPCR results of the bax transcriptional levels in the sorted H-G+ and c-D+ cells from 3dpf WT midbrains. The data are from three independent experiments. Each dot represents an independent experiment. f The transplantation workflow created with photoshop CS6. g Fluorescent images of H-G+ neurons (top) and WISH of apoeb (bottom) in baxcq55 recipient midbrains at 17 hpt. h The percentage of baxcq55 recipients showing rescued apoeb+ signals in (g). The number in each histogram indicates the average percentage. Data are pooled from three independent experiments. i Representative images of apoeb WISH and NR staining signals in the midbrains of siblings, baxcq55, baxcq55/Tg(NBT:bax) and baxcq55/Tg(coro1a:bax). j The number and percentage of PM, AM and RM in 3 dpf midbrains (n = 6 fish in each group). k Schematic diagram of neuronal Bax regulating microglial maturation, created with BioRender.com. cb cerebellum, mhb mid-hindbrain boundary, IHC immunohistochemistry, D dorsal, V ventral, E eye, OT optic tectum, zBax zebrafish Bax, hpt hours post transplantation, WISH whole-mount in situ hybridization, NR neutral red. The number in each histogram of (h) and (j) indicates the average percentage. Numbers in the right corners in (g) and (i) indicate the counts of embryos with a typical appearance (first number) in the total examined fishes (last number). Error bars, mean ± SEM. ****P < 0.0001, Unpaired two-tailed Student’s t test. Source data are provided as a Source Data file. |
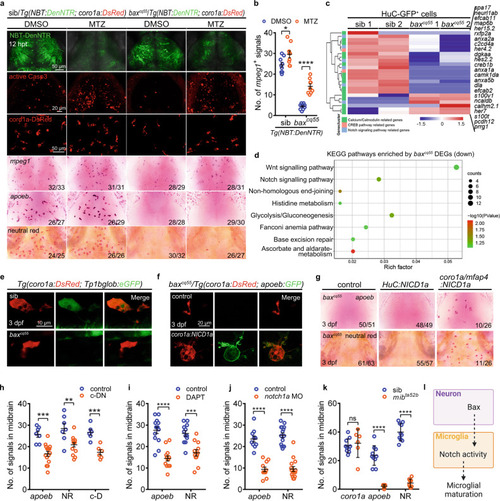
Bax controls microglial maturation via Notch signaling.
a The images of NBT-DenNTR+, active Casp3+, coro1a-DsRed+, mpeg1 WISH, apoeb WISH and NR staining signals in DMSO and/or MTZ-treated midbrains at 12 h post-treatment (hpt). b Quantification of mpeg1+ signals in (a) (DMSO: sib: n = 9, baxcq55: n = 10; MTZ: sib: n = 9, baxcq55: n = 9). c Heat-map of altered genes in 3 dpf H-G+ cells. The altered Calcium/Calmodulin, CREB, and Notch signaling pathway were indicated by different colors. d KEGG pathways of the down-regulated genes in 3 dpf red c-K+ cells. Enrichment P values were calculated with Fisher’s Exact test. Multiple testing was corrected using FDR correction. e Representative images of DsRed+ and GFP+ signals. f Representative images of a-G+ signals after supplying coro1a:NICD1a. g Representative images of apoeb WISH and NR staining after supplying HuC:NICD1a or coro1a/mfap4:NICD1a. h Quantification of apoeb+, NR+ and c-D+ signals in 3 dpf midbrains of Tg(coro1a:DN-MAML-FLAG) (c-DN) (apoeb: control: n = 7, c-DN: n = 15; NR: control: n = 7, c-DN: n = 15; c-D: n = 6 per group). i, j Quantification of apoeb+ and NR+ signals in 3 dpf midbrains treated with DAPT (i, apoeb: control: n = 14, DAPT: n = 13; NR: n = 12 per group) or notch1a MO (j, apoeb: control: n = 10, notch1a MO: n = 11; NR: n = 15 per group). k Quantification of coro1a+, apoeb+ and NR+ signals in 3 dpf midbrains (coro1a: sib: n = 10, mibta52b: n = 6; apoeb: sib: n = 10, mibta52b: n = 9; NR: n = 10 per group). l A diagram of neuronal Bax dictating microglial development via Notch signaling, created with BioRender.com. Each dot in (b, h–k) denotes one fish. Numbers in the right corners in (a) and (g) indicate the counts of embryos with a typical appearance (first number) in the total examined fishes (last number). Error bars, mean ± SEM. *P < 0.05; **P < 0.01; ***P < 0.001; ****P < 0.0001; ns no significant, Unpaired two-tailed Student’s t test. Source data are provided as a Source Data file. |
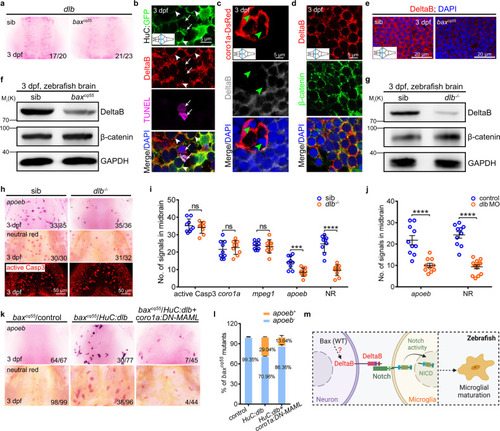
Neuronal DeltaB serves as a key ligand triggering Notch activation in microglia.
a WISH of dlb in 3 dpf midbrains. b–d Immunofluorescence of HuC-GFP (green) with DeltaB (red) and TUNEL (magenta) (b) or coro1a-DsRed (red) with DeltaB (gray) (c) or DeltaB (red) with β-catenin (green) (d) in the transverse sections of 3 dpf midbrains. DeltaB mainly co-localized with the GFP+ signals in membrane (white arrowhead), rarely with DsRed+, neither TUNEL signals (white arrow), nor non-phagocytized cells (green arrowhead). e Immunofluorescence of DeltaB in the transverse sections of 3 dpf midbrains. f, g WB of DeltaB, β-catenin and GAPDH in baxcq55 (f) and dlb-/- (g). The experiments were repeated three times and the results were similar. h Representative images of apoeb WISH, NR staining, and active Casp3 immunofluorescence in 3 dpf midbrains. i, j Quantification of active Casp3+, coro1a+, mpeg1+, apoeb+, and NR+ signals in siblings and dlb-/- (i, active Casp3, coro1a: n = 9 per group; mpeg1, apoeb, NR: sib: n = 9, dlb-/-: n = 10 per group) and apoeb+ and NR+ signals in control and dlb MO group (j, apoeb: n = 10 per group; NR: control: n = 10, dlb MO: n = 14). Each dot denotes one fish. k Representative images of apoeb WISH and NR staining in the midbrains after supplying HuC:dlb or synergistic application of HuC:dlb and coro1a:DN-MAML. l The percentage of baxcq55 mutants with rescued apoeb+ signals in (k). The number in each histogram indicates the average percentage. Data are pooled from three independent experiments. m A diagram of neuronal DeltaB inducing Notch activation in microglia, created with BioRender.com. WB, western blot. The inserted panels in (b–e) indicate the positions sectioned (blue line). Numbers in the right corners in (a, h, and k) indicate the counts of embryos with a typical appearance (first number) in the total examined fishes (last number). Error bars, mean ± SEM. ***P < 0.001; ****P < 0.0001; ns no significant, Unpaired two-tailed Student’s t test. Source data are provided as a Source Data file. |
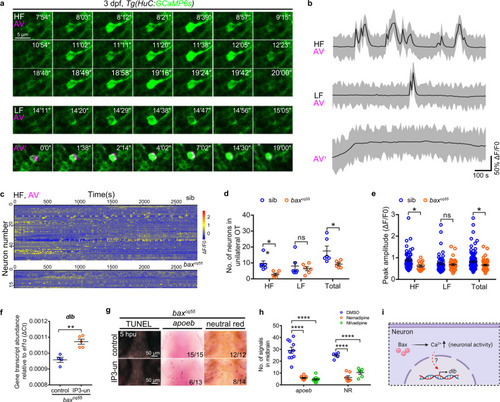
Bax drives dlb expression via a special type of neuronal activities.
a Confocal time-lapse imaging of GCaMP6s+ signals (green) in HF (top), LF (middle) and AV+ apoptotic neurons (bottom, magenta) in the midbrains. The number in the up-right corner indicated the time pointes. b Representative patterns of Ca2+ events in the HF, LF, and AV+ neurons during 1000 seconds of imaging. c GCaMP6s+ traces of HF neurons in the unilateral midbrains of 3 dpf siblings and baxcq55 mutants (n = 6 per group). d The number of HF, LF, and total active neurons in the unilateral midbrains of 3 dpf siblings and baxcq55 mutants. Each dot denotes one fish (n = 6 per group). e Quantification of the peak amplitude of calcium events (ΔF/F0) of HF, LF, and total calcium events in the unilateral midbrains of 3 dpf siblings and baxcq55 mutants (n = 6 fish in each group). Each dot denotes one calcium event. f qPCR result of the dlb transcriptional level at 5 hpu. The data are from three independent experiments. Each dot represents an independent experiment. g Representative images of apoeb WISH, NR and TUNEL staining in the midbrains of baxcq55 mutant at 5 hpu. h Quantification of apoeb+ and NR+ signals after application of nemadipine and nivadipine. Each dot denotes one fish (apoeb: n = 10 per group; NR: DMSO: n = 5, nemadipine: n = 7, nilvadipine: n = 6). i Schematic presentation of Bax regulating dlb via neuronal activity, created with BioRender.com. HF high frequency, LF low frequency, AV Annexin V, IP3-un IP3 uncaging, hpu hours post-uncaging. Numbers in the right corners in (g) indicate the counts of embryos with a typical appearance (first number) in the total examined fishes (last number). Error bars, mean ± SEM. *P < 0.05; **P < 0.01; ****P < 0.0001; ns no significant, Unpaired two-tailed Student’s t test. Source data are provided as a Source Data file. |
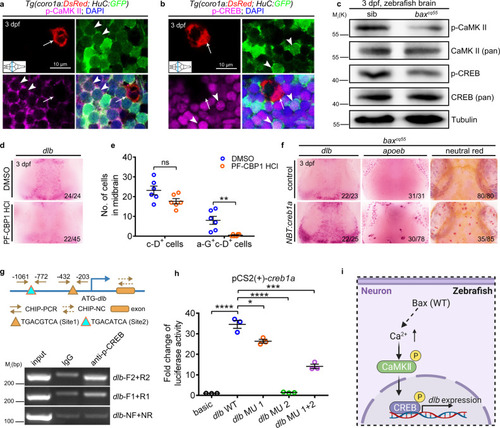
The CaMKII-CREB pathway regulates dlb expression and microglial maturation.
a Immunofluorescence of p-CaMKII (magenta), H-G (green) and c-D (red) in the transverse sections of 3 dpf WT midbrain. p-CaMKII co-stained with GFP+ (white arrowhead) but not DsRed+ (white arrow) signals. b Immunofluorescence of p-CREB (magenta), H-G (green) and c-D (red) in the transverse sections of 3 dpf WT midbrain. p-CREB merged with GFP+ (white arrowhead) but not DsRed+ (white arrow) signals. c WB of p-CaMKII, CaMKII (pan), p-CREB, CREB (pan), and Tubulin in the brain cells from 3 dpf siblings and baxcq55 mutants. The experiments were repeated three times and the results were similar. d WISH of dlb in 3 dpf midbrains after treated with DMSO or PF-CBP1 HCl. e The number of c-D+ and a-G+c-D+ signals in 3 dpf midbrains after DMSO and PF-CBP1 HCl treatment. Each dot denotes one fish (n = 6 in each group). f Representative images of dlb and apoeb WISH, and NR staining in the baxcq55 midbrains after supplying NBT:creb1a. g Top panel: the predicted schematic structure of dlb promoter with two potential CREB binding sites. Bottom panel: the gel results of ChIP-PCR. p-CREB binding sites 1 and 2 were amplified by the dlb-F1/R1 and dlb-F2/R2 primers, respectively. dlb-NF/NR primers were used as the negative control. h Quantification of fold alterations in the luciferase activities after transfected with different vectors. Data were pooled from three independent experiments. Each dot represents an independent experiment. i A diagram of the CaMKII-CREB axis in controlling dlb expression, created with BioRender.com. MU, mutation. Numbers in the right corners in (d) and (f) indicate the counts of embryos with a typical appearance (first number) in the total examined fishes (last number). Error bars, mean ± SEM. *P < 0.05; **P < 0.01; ***P < 0.001; ****P < 0.0001; ns no significant, Unpaired two-tailed Student’s t test. Source data are provided as a Source Data file. |
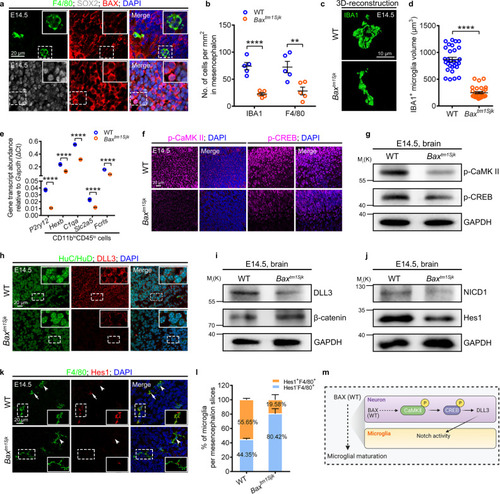
Baxtm1Sjk mutant mice exhibit compromised microglial maturation and Notch signaling.
a Immunofluorescence of BAX (red) with SOX2 (gray) and F4/80 (green) in the sagittal sections of E14.5 mice brains. b Quantification of IBA1+ and F4/80+ cell density in E14.5 WT and Baxtm1Sjk mice midbrains. Each dot denotes one mouse (n = 5 mice in each group). Three sections per mouse were quantified. c, d 3D reconstructions of confocal z-stacks (c) and measured volume (d) of IBA1+ cells in E14.5 WT and Baxtm1Sjk mice mesencephalon (n = 3 mice in each group). Each dot in (d) denotes one cell. Ten cells per mouse were quantified. e Transcriptional levels of P2ry12, Hexb, C1qa, Slc2a5, and Fcrls in CD11bhiCD45lo cells from E14.5 WT and Baxtm1Sjk mice mesencephalon. The data are from three independent experiments. Each dot represents an independent experiment. f Immunofluorescence of p-CaMKII (left) and p-CREB (right) in brain sagittal sections of E14.5 WT and Baxtm1Sjk mice. g WB of p-CaMKII, p-CREB and GAPDH in the brain cells from E14.5 WT and Baxtm1Sjk mice. The experiments were triply repeated. The results were similar. h Immunofluorescence of HuC/HuD (green) and DLL3 (red) in the brain sagittal sections of E14.5 WT and Baxtm1Sjk mice. i, j WB of DLL3 and β-catenin (i), NICD1 and Hes1 (j) in the brain cells from E14.5 WT and Baxtm1Sjk mice. The experiments were triply repeated. The results were similar. k Immunofluorescence of F4/80 (green) and Hes1 (red) in the brain sagittal sections of E14.5 WT and Baxtm1Sjk mice. White arrows indicated the co-stained signals. White arrowheads presented the F4/80+ signals only. l The percentage of F4/80+ microglia with or without Hes1+ signals in (k) (n = 4 mice in each group). Three sections per mouse were quantified. The number in each histogram indicates the average percentage. m A diagram of the Bax-Notch axis in regulating microglial maturation, created with BioRender.com. The small images in the right corners of (a, h, and k) are the enlargement regions (white dotted box). Error bars, mean ± SEM. **P < 0.01; ****P < 0.0001, Unpaired two-tailed Student’s t test. Source data are provided as a Source Data file. |
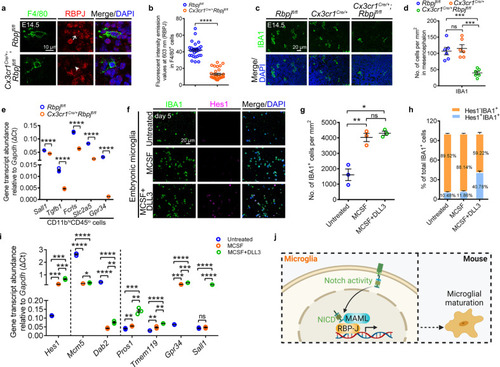
Notch activity promotes microglial development in vivo and in vitro.
a, b Immunofluorescence (a) and fluorescent intensity emission values (b) of RBPJ (red) in F4/80+ (green) cells in the sagittal sections of E14.5 Rbpjfl/fl and Cx3cr1cre/+Rbpjfl/fl mice (n = 3 mice in each group). Each dot in (b) denotes one cell. Ten cells per mouse were quantified. The white arrow indicates the co-localized signals of RBPJ and F4/80, whereas white arrowhead point to the limited signals of RBPJ. c, d Immunofluorescence (c) and quantified cell density (d) of IBA1+ cells in the sagittal sections of E14.5 Rbpjfl/fl, Cx3cr1cre/+ and Cx3cr1cre/+Rbpjfl/fl mice (n = 6 mice in each group). Each dot denotes one mouse. Three slices per mouse were quantified. e Transcriptional levels of Sall1, Tgfb1, Fcrls, Slc2a5, and Gpr34 in CD11bhiCD45lo cells from E14.5 Rbpjfl/fl and Cx3cr1cre/+Rbpjfl/fl mice mesencephalon. The data are from three independent experiments. Each dot represents an independent experiment. f Immunofluorescence of IBA1 and Hes1 in the embryonic microglia in vitro furnished with MCSF or additional DLL3 for 5 days. g Quantification of IBA1+ cell density in (f). Data were pooled from three independent experiments. Cultured IBA1+ cells in each experiment were from twenty E12.5 mice mesencephalon. Each dot represents individual experiment. h The percentage of Hes1-IBA1+ or Hes1+IBA1+ cells after cultured 5 days in (f). The number in each histogram indicates the average percentage. Data are pooled from three independent experiments. i Transcriptional levels of Hes1, Mcm5, Dab2, Pros1, Tmem119, Gpr34, and Sall1 in embryonic microglia after cultured for 5 days. The data were from three independent experiments. Each dot represents an independent experiment. j Schematic diagram of Notch activation in mouse microglial differentiation, created with BioRender.com. Error bars, mean ± SEM. *P < 0.05; **P < 0.01; ***P < 0.001; ****P < 0.0001; ns no significant, Unpaired two-tailed Student’s t test. Source data are provided as a Source Data file. |