
Fig. 3
- ID
- ZDB-FIG-221022-3
- Publication
- Zhao et al., 2022 - Brain milieu induces early microglial maturation through the BAX-Notch axis
- Other Figures
- All Figure Page
- Back to All Figure Page
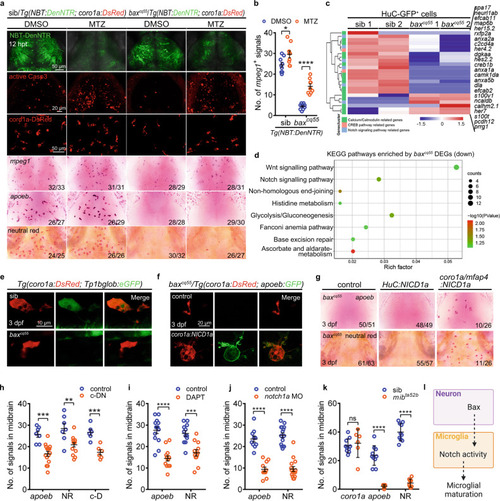
Bax controls microglial maturation via Notch signaling.
a The images of NBT-DenNTR+, active Casp3+, coro1a-DsRed+, mpeg1 WISH, apoeb WISH and NR staining signals in DMSO and/or MTZ-treated midbrains at 12 h post-treatment (hpt). b Quantification of mpeg1+ signals in (a) (DMSO: sib: n = 9, baxcq55: n = 10; MTZ: sib: n = 9, baxcq55: n = 9). c Heat-map of altered genes in 3 dpf H-G+ cells. The altered Calcium/Calmodulin, CREB, and Notch signaling pathway were indicated by different colors. d KEGG pathways of the down-regulated genes in 3 dpf red c-K+ cells. Enrichment P values were calculated with Fisher’s Exact test. Multiple testing was corrected using FDR correction. e Representative images of DsRed+ and GFP+ signals. f Representative images of a-G+ signals after supplying coro1a:NICD1a. g Representative images of apoeb WISH and NR staining after supplying HuC:NICD1a or coro1a/mfap4:NICD1a. h Quantification of apoeb+, NR+ and c-D+ signals in 3 dpf midbrains of Tg(coro1a:DN-MAML-FLAG) (c-DN) (apoeb: control: n = 7, c-DN: n = 15; NR: control: n = 7, c-DN: n = 15; c-D: n = 6 per group). i, j Quantification of apoeb+ and NR+ signals in 3 dpf midbrains treated with DAPT (i, apoeb: control: n = 14, DAPT: n = 13; NR: n = 12 per group) or notch1a MO (j, apoeb: control: n = 10, notch1a MO: n = 11; NR: n = 15 per group). k Quantification of coro1a+, apoeb+ and NR+ signals in 3 dpf midbrains (coro1a: sib: n = 10, mibta52b: n = 6; apoeb: sib: n = 10, mibta52b: n = 9; NR: n = 10 per group). l A diagram of neuronal Bax dictating microglial development via Notch signaling, created with BioRender.com. Each dot in (b, h–k) denotes one fish. Numbers in the right corners in (a) and (g) indicate the counts of embryos with a typical appearance (first number) in the total examined fishes (last number). Error bars, mean ± SEM. *P < 0.05; **P < 0.01; ***P < 0.001; ****P < 0.0001; ns no significant, Unpaired two-tailed Student’s t test. Source data are provided as a Source Data file. |