
Fig. 4
- ID
- ZDB-FIG-221022-4
- Publication
- Zhao et al., 2022 - Brain milieu induces early microglial maturation through the BAX-Notch axis
- Other Figures
- All Figure Page
- Back to All Figure Page
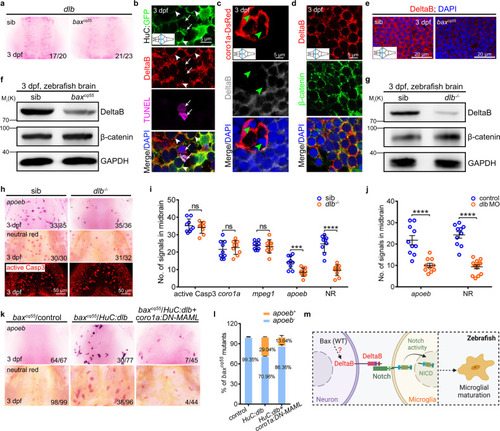
Neuronal DeltaB serves as a key ligand triggering Notch activation in microglia.
a WISH of dlb in 3 dpf midbrains. b–d Immunofluorescence of HuC-GFP (green) with DeltaB (red) and TUNEL (magenta) (b) or coro1a-DsRed (red) with DeltaB (gray) (c) or DeltaB (red) with β-catenin (green) (d) in the transverse sections of 3 dpf midbrains. DeltaB mainly co-localized with the GFP+ signals in membrane (white arrowhead), rarely with DsRed+, neither TUNEL signals (white arrow), nor non-phagocytized cells (green arrowhead). e Immunofluorescence of DeltaB in the transverse sections of 3 dpf midbrains. f, g WB of DeltaB, β-catenin and GAPDH in baxcq55 (f) and dlb-/- (g). The experiments were repeated three times and the results were similar. h Representative images of apoeb WISH, NR staining, and active Casp3 immunofluorescence in 3 dpf midbrains. i, j Quantification of active Casp3+, coro1a+, mpeg1+, apoeb+, and NR+ signals in siblings and dlb-/- (i, active Casp3, coro1a: n = 9 per group; mpeg1, apoeb, NR: sib: n = 9, dlb-/-: n = 10 per group) and apoeb+ and NR+ signals in control and dlb MO group (j, apoeb: n = 10 per group; NR: control: n = 10, dlb MO: n = 14). Each dot denotes one fish. k Representative images of apoeb WISH and NR staining in the midbrains after supplying HuC:dlb or synergistic application of HuC:dlb and coro1a:DN-MAML. l The percentage of baxcq55 mutants with rescued apoeb+ signals in (k). The number in each histogram indicates the average percentage. Data are pooled from three independent experiments. m A diagram of neuronal DeltaB inducing Notch activation in microglia, created with BioRender.com. WB, western blot. The inserted panels in (b–e) indicate the positions sectioned (blue line). Numbers in the right corners in (a, h, and k) indicate the counts of embryos with a typical appearance (first number) in the total examined fishes (last number). Error bars, mean ± SEM. ***P < 0.001; ****P < 0.0001; ns no significant, Unpaired two-tailed Student’s t test. Source data are provided as a Source Data file. |