
Fig. 8
- ID
- ZDB-FIG-221022-8
- Publication
- Zhao et al., 2022 - Brain milieu induces early microglial maturation through the BAX-Notch axis
- Other Figures
- All Figure Page
- Back to All Figure Page
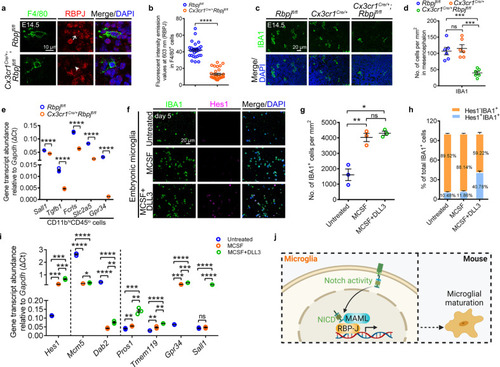
Notch activity promotes microglial development in vivo and in vitro.
a, b Immunofluorescence (a) and fluorescent intensity emission values (b) of RBPJ (red) in F4/80+ (green) cells in the sagittal sections of E14.5 Rbpjfl/fl and Cx3cr1cre/+Rbpjfl/fl mice (n = 3 mice in each group). Each dot in (b) denotes one cell. Ten cells per mouse were quantified. The white arrow indicates the co-localized signals of RBPJ and F4/80, whereas white arrowhead point to the limited signals of RBPJ. c, d Immunofluorescence (c) and quantified cell density (d) of IBA1+ cells in the sagittal sections of E14.5 Rbpjfl/fl, Cx3cr1cre/+ and Cx3cr1cre/+Rbpjfl/fl mice (n = 6 mice in each group). Each dot denotes one mouse. Three slices per mouse were quantified. e Transcriptional levels of Sall1, Tgfb1, Fcrls, Slc2a5, and Gpr34 in CD11bhiCD45lo cells from E14.5 Rbpjfl/fl and Cx3cr1cre/+Rbpjfl/fl mice mesencephalon. The data are from three independent experiments. Each dot represents an independent experiment. f Immunofluorescence of IBA1 and Hes1 in the embryonic microglia in vitro furnished with MCSF or additional DLL3 for 5 days. g Quantification of IBA1+ cell density in (f). Data were pooled from three independent experiments. Cultured IBA1+ cells in each experiment were from twenty E12.5 mice mesencephalon. Each dot represents individual experiment. h The percentage of Hes1-IBA1+ or Hes1+IBA1+ cells after cultured 5 days in (f). The number in each histogram indicates the average percentage. Data are pooled from three independent experiments. i Transcriptional levels of Hes1, Mcm5, Dab2, Pros1, Tmem119, Gpr34, and Sall1 in embryonic microglia after cultured for 5 days. The data were from three independent experiments. Each dot represents an independent experiment. j Schematic diagram of Notch activation in mouse microglial differentiation, created with BioRender.com. Error bars, mean ± SEM. *P < 0.05; **P < 0.01; ***P < 0.001; ****P < 0.0001; ns no significant, Unpaired two-tailed Student’s t test. Source data are provided as a Source Data file. |