FIGURE SUMMARY
Title

Meningococcal virulence in zebrafish embryos depends on capsule polysaccharide structure

Authors
Schipper, K., Preusting, L.C., van Sorge, N.M., Pannekoek, Y., van der Ende, A.
Source
Full text @ Front Cell Infect Microbiol

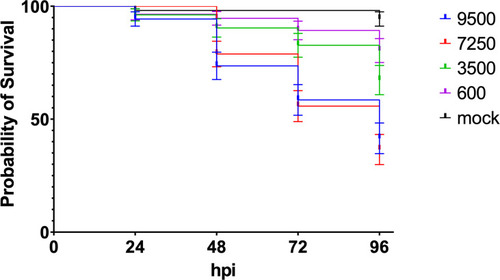
Dose dependent killing of zebrafish embryos by H44/76_B expressing mCherry (numbers in cfu, 20 embryos in each group). Triplicate with 20 embryos in each group.

Fluorescence microscopy of zebrafish embryos at 28 hpf infected with mCherry expressing H44/76_B meningococci (5000 cfu). (A) Zebrafish embryos infected with red fluorescent meningococci. From top to bottom: No meningococci visible, meningococci in the head, meningococci in the tail and meningococci throughout the body. Images taken at 48 hpi; arrow head shows pericardial edema. Bar represents 750 μm. (B) Distribution of meningococci in infected zebrafish embryos.

(A) Survival curve of zebrafish embryos infected with capsulated H44/76 (9600 cfu) or non-encapsulated meningococci HB-1 (5200 cfu); 20 embryos in each group. (B) Survival scored at 96 hpi (right panel). Zebrafish embryos were infected with mCherry-expressing H44/76_B (2700 ± 1820 cfu), HB-1 (1960 ± 1420 cfu) or mock-infected. Three independent experiments each with 20 embryos in each group. (C). Survival and multiplication of meningococci (H44/76_B) or non-encapsulated meningococci (HB-1) in zebrafish embryos. Zebrafish embryos were infected with mCherry expressing H44/76_B (3000 cfu) or HB-1 (2800 cfu); 10 embryos in each group. ** P = < 0.01, ***: P = < 0.001.

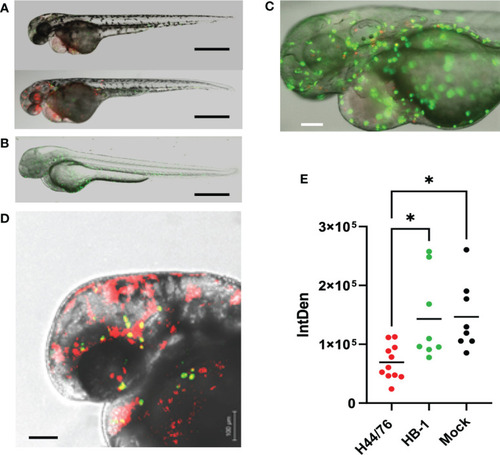
Fluorescence microscopy of H44/76 meningococci expressing mCherry (red fluorescence) and neutrophils expressing GFP (green fluorescence) in zebrafish embryos. (A). H44/76 infected embryos at 24 hpi, Bar represents 100 μm. (B). HB-1 infected embryo at 24 hpi. (C). Detail of H44/76 infected embryo showing green fluorescent neutrophils and red fluorescent meningococci. (D) Detail of H44/76 infected embryo showing green fluorescent neutrophils and red fluorescent meningococci in the embryo head. Yellow color shows overlap between meningococci and neutrophils.Scale bars represent 100 μm. (E) Number of neutrophils in zebrafish embryos 24hpi of N. meningitidis H44/76 serogroup B (1400 cfu) or non-encapsulated HB-1 (1600 cfu) and mock-infected; 11 embryos infected with H44/76, two groups of 8 embryos infected with HB-1 or mock infected, respectively. IntDen = Integrated density of the green fluorescence signal in the area of interest. * P = < 0.05.

(A) Survival curve of zebrafish embryos infected with H44/76 expressing serogroup B capsule (1560 cfu), no capsule (HB-1) (3600 cfu), serogroup C capsule (H44/76_C) (1200 cfu), serogroup W capsule (H44/76_W) (3600 cfu) or serogroup Y capsule (H44/76_Y) (4800 cfu) all expressing mCherry 20 embryos in each group. (B) Survival of zebrafish embryos infected with H44/76 expressing serogroup B capsule (2700 ± 1820 cfu), no capsule (HB-1) (1960 ± 1420 cfu), serogroup C capsule (H44/76_C) (2160 ± 1660 cfu), serogroup W capsule (H44/76_W) (2760 ± 840 cfu) or serogroup Y capsule (H44/76_Y) (2720 ± 1817 cfu) scored at 96hpi. Three independent experiments, 20 embryos in each group. (C) Quantification of GFP-expressing neutrophils in zebrafish embryos 24 hpi with N. meningitidis H44/76_B (1400 cfu), HB-1 (1600 cfu), H44/76_C (1400 cfu), H44/76_W (4000 cfu), H44/76_Y (3000 cfu) or PBS (Mock); 11, 8, 9, 8, 7 and 8 embryos per group, respectively. IntDen = Integrated density of the green fluorescence signal in the area of interest. * P = < 0.05, ** P = < 0.01, **** P = < 0.0001.

Relation between metabolic cost and meningococcal virulence in zebrafish embryos. Lines represent linear regression. Red: Zebrafish embryo survival after 96 hours post infection with either of the four isogenic capsule variants is the ratio between the number of embryos survived after meningococcal infection and after mock infection (r=0.9090). Blue: Integrated density of the green fluorescence signal as a measure of the number of neutrophils in the area of interest after 24 hours post infection with either of the four isogenic capsule variants divided by that of mock infection; neutrophil count relative to mock-infected zebrafish embryos (r=0.9097).

Acknowledgments
This image is the copyrighted work of the attributed author or publisher, and ZFIN has permission only to display this image to its users. Additional permissions should be obtained from the applicable author or publisher of the image. Full text @ Front Cell Infect Microbiol