
|
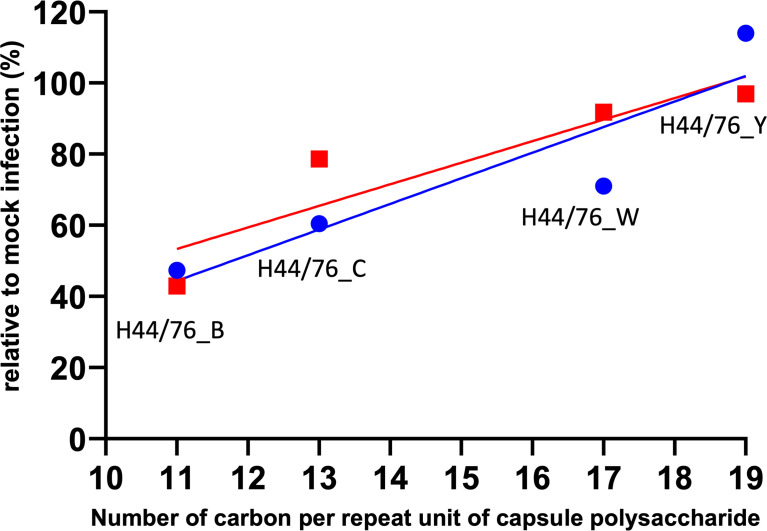
Figure 6
Relation between metabolic cost and meningococcal virulence in zebrafish embryos. Lines represent linear regression. Red: Zebrafish embryo survival after 96 hours post infection with either of the four isogenic capsule variants is the ratio between the number of embryos survived after meningococcal infection and after mock infection (r=0.9090). Blue: Integrated density of the green fluorescence signal as a measure of the number of neutrophils in the area of interest after 24 hours post infection with either of the four isogenic capsule variants divided by that of mock infection; neutrophil count relative to mock-infected zebrafish embryos (r=0.9097).